 |
Mathematical and Technological Literacy I |
|
|
|
Mathematical and Technological Literacy I |
|
1. When would you use the following types of graphs:
Pie Chart -
Bar Chart -
X Y Scatter (Line Graph) -
2. Checklist for making an effective graph
a. What
is the purpose of making a graph from this data?
b. What type of graph should you make?
pie bar
x-y scatter (line)
c.
Decide on a title and consider the the W's (who, what, where and when)
d.
Do you need to include a legend? yes
no
e. Add a descriptive x-axis and y-axis label for bar and xy-scatter graphs
f.
Add percentages for pie chart
g.
Adjust the scale for bar and xy-scatter graphs (if applicable)
h.
Add source
3. Creating Graphs
Create a pie chart using: LeadingCausesOfDeath2003.xls
Create a bar chart using: DePaulMajors04.xls
Create a line graph using: O'HareTempApril2003.xls
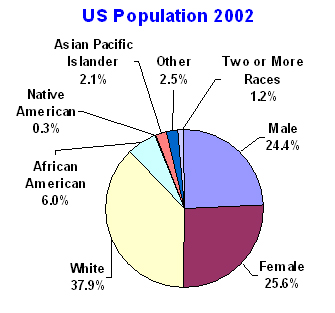
4. What's wrong with this chart?
4. Misleading Graphs (casino)
