 |
Mathematical and Technological Literacy I |
|
|
|
Mathematical and Technological Literacy I |
|
Please do the following at the beginning of every computer activity.
a. Open a new Word document. At the top of the document enter all group members names and last names, and Activity number.
b. Click on the Office Button in the upper left corner, then slide over "Save As". Choose either "Word Document" to save your document as a Word 2010 document or "Word 97-2003 document" to save your document in an early version of Word. If you are not sure which to choose, you should use "Word 97-2003 document". When you are working on your document in class, first save the document to the desktop by setting the "Save in" textbox to "Desktop". (Saving to the desktop makes it easy to retrieve your work when you are finished.) Your file name should be entitled something like "Group Activity 1". Last, confirm the save as type in the last box. (*.docx) is the suffix for a Word 2010 document. (*.doc) is the suffix for early versions of Word. When you are leaving the class, upload your saved document into your Group files folder (Group Locker) in D2L. That way if you completed your activity you can submit it via D2Ldropbox, and if you are not yet finished you can access the partially completed file via D2L to complete it later.How to save your file: Always save your work as .doc or .docx format.
Where to save your file: When working in class, save it on your desktop. When leaving class, always save your activity in the Group Files under your Activity Group in D2L. All work must be saved here. Additional options of saving such as email or flash drives are only back up methods and should not be used as primary modes of saving.
How to submit your activity: Once you complete your activity you need to submit it through D2L's Dropbox, under the correct dropbox for your activity. To ensure that you get evaluated and get a grade, make sure you submit before the deadline.
Deadlines are strict, no exceptions. Late submissions are not accepted. Incorrect submissions, submissions which cannot be opened due to wrong file type, or corrupt files will not be graded and will receive a grade of zero. Plagiarism receives a zero as a grade and will be reported without exception.
Learning Goals for this Activity
Activity
Open the file CarsAndTrucks_By_Year1970-MostRecent.xls contains data from the Bureau of Labor Statistics number of cars and small trucks on the road from 1970 through 2007.
a. Make an X-Y scatter plot of the data including the trendline and R-squared value. For instructions click here. Note that Excel will, in most cases, put a legend on your graph by default. When there is only one data series (as here), you don't need a legend, and it really should be removed. Paste this chart in your Word document.
b. Predict how many cars and trucks there will be in the US in the year 2012 using the slope and intercept functions in Excel. We recommend using the slope and intercept functions when you are modeling because the equation that Excel puts on the graph is often rounded to only a few decimal places. Using the equation that Excel puts on the graph can lead to aberrant results because of this rounding.
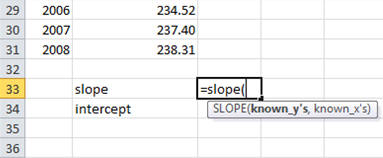
To calculate your prediction, type "slope" in cell B33 and "intercept" in cell B34. (You can actually choose any empty cell that is convenient.) Next, in the neighboring cell, type "=slope(". At this point, Excel will prompt you to select the y-values and the x-values with your mouse.
After selecting the appropriate y-values and x-values, your screen will look like:
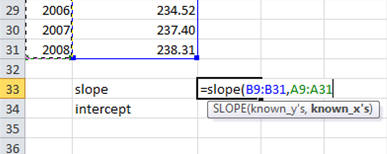
Finally, type a closing parenthesis and press enter.
Repeat the process with the "intercept" function:
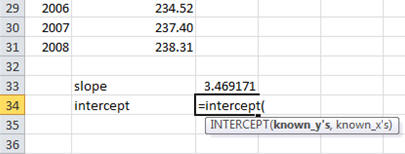
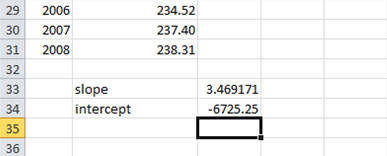
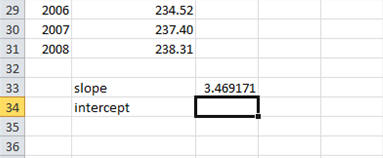
When are done, you will have the slope and intercept of the least squares best fit line in cells C33 and C34 respectively:
"Slope" and "intercept" are examples of Excel's built-in functions. You can see a list of all the functions available by clicking the "insert function" button
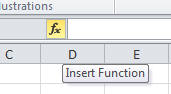
This library of functions is very useful, and we will be using other functions in this library during the course.
To make your prediction, type "=C33*2012+C34" in a cell somewhere. Type your prediction (expressed in the appropriate units) into your Word document.
c. You can double check your prediction in b
using by visually extending the trendline you made in part b. Here is how
you do this: Right click on the trendline and then choose "Format Trendline."
Then click on the Options tab. In the center you will find a box entitled
"Forecast." In the "Forward" box, enter 4 to predict the number of
passenger cars and trucks there will be in 2012. Reading the graph, you can
get an approximate prediction that should be very close the prediction you
got with your equation. Paste the graph with your extended trendline in
your Word document.
Visually extending the trendline is a good check on your algebraic
calculations, and it is highly recommended. Occasionally, the
rough, approximate prediction one can make from the extended trendline on
the graph is sufficient to the task at hand; however, most often, we use the
predictions obtained algebraically from the equations.
d. How much confidence do you have in the prediction you made with your model? Use the language that we discussed in class.
e. Calculate when there were no passenger cars and trucks in the US using the regression equation. Probably the easiest way to accomplish this task is use algebra on a piece of paper. Type your result in your Word document. As in part c, you can also extend the trendline "Backward" as a good check on your work.
f. About when were cars actually invented? (If you don't know, do an Internet search.) In light in the facts about when cars were really invented, how accurate was your model in predicting when there were no cars? Explain why the model performed so badly even though it fits the existing data rather well.
g. Predict the number of cars in US in 2050. How much confidence do you have in your prediction? Explain why.
2. Open the file Coal_Consumption1970-MostRecent.xls containing data from the U.S. Energy Administration. The unit of measure here is quads, a standard measure standing for quadrillion BTU's. (A British Thermal Unit is a unit of energy, the amount of energy needed to raise 1 pound of water 1 degree Fahrenheit when the water is about 39.2 degrees Fahrenheit.)
a. Make an X-Y scatterplot of the data. Add a trendline, including the equation of the line and the R-squared value. Paste this chart into your Word document.
b. Predict coal consumption in the year 2010 using the regression equation and double check your prediction by extending the trendline on the graph. Type your answer and paste your graph in you Word document.
c. Using the equation of the model, predict when coal consumption reach 30 quads?
d. In a short well-written paragraph, discuss social, political, or physical changes which might affect the accuracy of predictions using this model.
3. Linear models occur frequently in real settings not accompanied by data. For each of the described setting, give a formula for the corresponding linear model
a. A calling card offers a price of $0.23 cents per minute at any time during the day with a monthly service charge of $1.00. Express the monthly cost as a function of minutes called.
b. At 0 degrees Celsius, the speed of sound is 350 meters per second and it increases by 0.2 m/s for each increase of 1 degree Celsius. Express the speed of sound as a function of temperature in Celsius.
c. A helicopter takes off from the roof of a building that is 200 feet about the ground. The altitude of the helicopter increases by 150 feet each minute. Express the height of the helicopter as a function of minutes after it starts rising.
d. A car rental agency charges $29.00 plus 6 cents per mile for a one day rental. Express the cost of renting the car as a function of miles driven.