 |
Mathematical and Technological Literacy I
Assignment 2:
Exponential Modeling with Percentages |
 |
Please do the following for each
individual assignment
Open a new Word document. At the top of
the document enter all group members names and last names, and Assignment
number.
How to save your file: Always save your work as
.doc or .docx format.
Where to save your file: Always save your activity
in the Group Files under your Activity Group in D2L. All work must be saved
here. Additional options of saving such as email or flash drives are only back
up methods and should not be used as primary modes of saving.
How to submit your activity: Once you complete your
activity you need to submit it through D2L's Dropbox, under the correct dropbox
for your activity. To ensure that you get evaluated and get a grade, make sure
you submit before the deadline.
Deadlines are strict, no exceptions.
Late submissions are not accepted. Incorrect
submissions, submissions which cannot be opened due to wrong file type, or
corrupt files will not be graded and will receive a grade of zero. Plagiarism
receives a zero as a grade and will be reported without exception.
1. a. A ticket to the Lovehammers concert at Metro was
marked up by 95.5%. If the original price was $10, what was the final
price including fees (the marked up price)?
b. On August 16, 2005, one
share of Telephone & Data Systems Inc. stock cost $42.90. On September 2, 2005, the stock closed
5% lower than the price on August 16th. What was the cost of one share of
Telephone & Data Systems Inc. stock on September 2nd?
2. The burning of fossil fuels (oil, coal, natural gas) releases carbon dioxide into
the atmosphere. Carbon dioxide is known as a greenhouse gas because it tends to trap
heat in the atmosphere, causing global warming. In 1995, the United States emitted
about 1.4 billion tons of carbon (as carbon dioxide) into the atmosphere. China was second
largest contributor, emitting 850 million tons. US emissions were increasing at 1.3%
a year, while Chinese emissions were increasing at 4% a year. Assuming these growth rates
continued determine the year when China will exceed US in carbon emissions.
| 3. In order to understand the prehistory of the Hawaiian island of Lana'i better, anthropologists Maria
Sweeney, Melinda Allen, and Boyd Dixon used radiocarbon dating on charcoal found
in an ancient dwelling site, the Kaunolu Village National Historic Landmark, the largest
archeological complex on the island. In one of their samples, they found that
approximately 94% of the original carbon 14 remained. Using the fact that Carbon 14
decays by 1.202% every 100 years, determine the approximate age of the this sample .
In your word document, paste the Excel table you made to come up with your answer. |

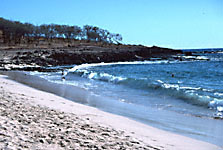
Hulopoe Beach on Lana'i
Copyright 1998 B. David Cathell, Phoenix, AZ |
Relative/Percentage
Change
Relative Change =
 =
=

For
communication purposes, we convert relative change, which is a fraction
(converted to a decimal number) to a percentage (percentage change). The
following are three ways to convert a fraction (decimal number) to a
percentage:
For
this course, we will generally show percentages formatted to two (2) decimal
places (unless stated otherwise).
4. Chicken Bacteria: The information given
below was found on the label of a package of Chicken.
Bacteria Count on Chicken
(per square centimeter when refrigerated at 40º F)
| Day |
Bacteria |
Condition |
| 0 |
360 |
OK |
| 1 |
5,760 |
OK |
| 2 |
92,160 |
Fair |
| 3 |
1,474,560 |
Poor |
| 4 |
23,592,960 |
Odor |
| 5 |
377,487,360 |
Slime |
a. By using the percentage change formula above,
show that the above data is exponential. What is the percentage increase in bacteria each day?
b. It is also noted on the label that at 40º F, the bacteria
double in number every 6 hours. Make a new table showing the bacteria count every
6 hours. To get you started, you table should look like this:
| Hour |
Bacteria |
| 0 |
360 |
| 6 |
|
| 12 |
|
| 18 |
|
| 24 |
|
| 30 |
|
You should continue your hours column to 120 hours.
Paste your Excel table in your word document.
c. What is the percentage increase in bacteria every
six hours?
5. In 1980, the number
of African elephants was 1,200,000 but that number was decreasing 5.25% a year.
a. How many African elephants were there in
1988? Show either your table or your calculation.
b. How many years did it take for the population to reach 1/2 of what it was
originally? Show your table.
6. In 2010, the 2009 populations
and projected population rates were released for Russia and Ethiopia. The population of Russia in
2009 was 140.9 million; the population of Ethiopia was 82.8 million. Russia is decreasing in population by approximately 0.4%
annually; the population of Ethiopia is growing at 2.6%. Using Excel, answer the following questions.
a. How long, at the above rates, will it take
for the population of Ethiopia to double?
b. How long, at the above rates, will it take
for the population of Russia to reach 125 million?
