 |
Mathematical and Technological Literacy I
Assignment 3:
Graphing |
 |
Please do the following for each
individual assignment
Open a new Word document. At the top of
the document enter all group members names and last names, and Assignment
number.
How to save your file: Always save your work as
.doc or .docx format.
Where to save your file: Always save your activity
in the Group Files under your Activity Group in D2L. All work must be saved
here. Additional options of saving such as email or flash drives are only back
up methods and should not be used as primary modes of saving.
How to submit your activity: Once you complete your
activity you need to submit it through D2L's Dropbox, under the correct dropbox
for your activity. To ensure that you get evaluated and get a grade, make sure
you submit before the deadline.
Deadlines are strict, no exceptions.
Late submissions are not accepted. Incorrect
submissions, submissions which cannot be opened due to wrong file type, or
corrupt files will not be graded and will receive a grade of zero. Plagiarism
receives a zero as a grade and will be reported without exception.
1. Women in the United States continue to be paid less
than men overall. Nationally, in 2007, the median weekly earnings of
female full-time wage and salary workers totaled $614, while it was $766 for
males. (Source: Bureau of Labor Statistics report:
http://www.bls.gov/cps/cpswom2007.pdf )
a. Fill in the blanks using the data:
In 2007, male full-time wage and
salary workers earned _________ % more than female full-time wage and salary
workers.
In 2007, female full-time wage and salary workers earned _________ % less than
male full-time wage and salary
workers.
b. What percent of male full-time wage and salary worker median weekly
earnings does the female median weekly earnings represent? (This
percentage is often called the women-to-men's earning ratio.)
c. Using the data above ($614 for females and $766 for males), make a bar
chart that purposely exaggerates the difference between men and women.
Paste it into your Word document.
d. Using the data above ($614 for females and $766 for males), make a bar
chart that purposely makes the difference between men and women seem small.
Paste it into your Word document.
e. In the spirit of the story of Goldilocks, make a graph of the data that
you feel gives the most accurate, non-biased view of the difference between male
an female wages.
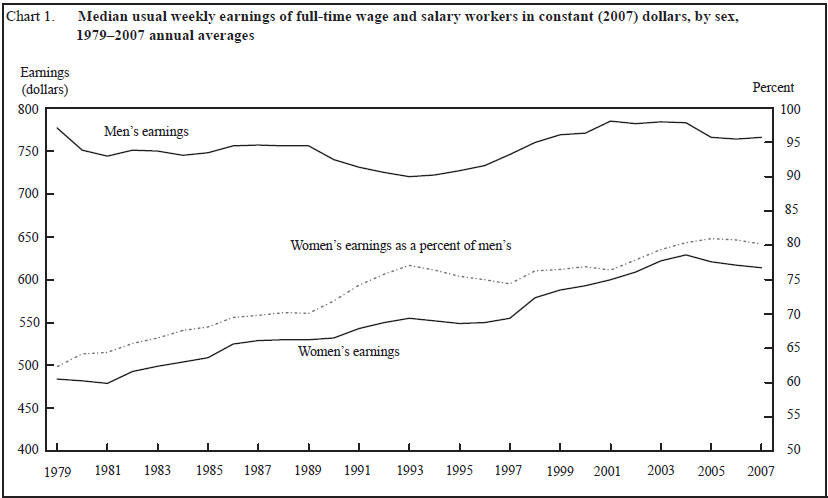
2. In the Bureau of Labor Standard's report
http://www.bls.gov/cps/cpswom2007.pdf, the authors include the following
complex chart.

In a 5-7 sentence paragraph, carefully describe
the graph. What do you want you audience to know about the data you
graphed? Address the following questions in your paragraph:
- Change in men's
earnings over time.
- Change women's earnings over time.
- The relationship between between men and women's
actual earnings over
time.
- The relationship between women's earnings as a percent of
men's earnings over time.
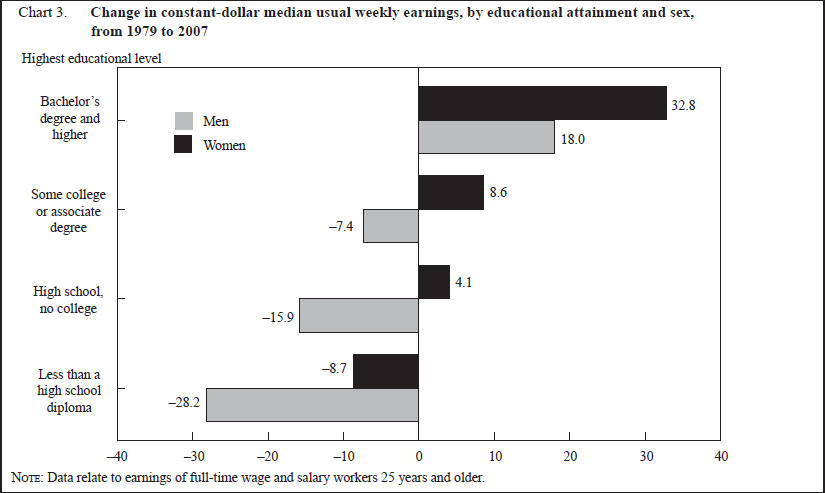
3. Another graph found in the Bureau of Labor Standard's
report
http://www.bls.gov/cps/cpswom2007.pdf shows the following:

a. What type of graph is this graph?
b. True or False: The graph shows that women with bachelor's degree or higher
earn more than men with bachelor's degrees or higher. Briefly explain your
answer.
c. In a 5-7 sentence paragraph , carefully describe what this graph tells about changes in
women's and men's earnings from 1979 to 2007. Address the following
questions in your paragraph:
- The changes in the data across the
categories. (Compare men and women.)
- The changes in the data within the categories.
(Only look at women and then only look at men.)
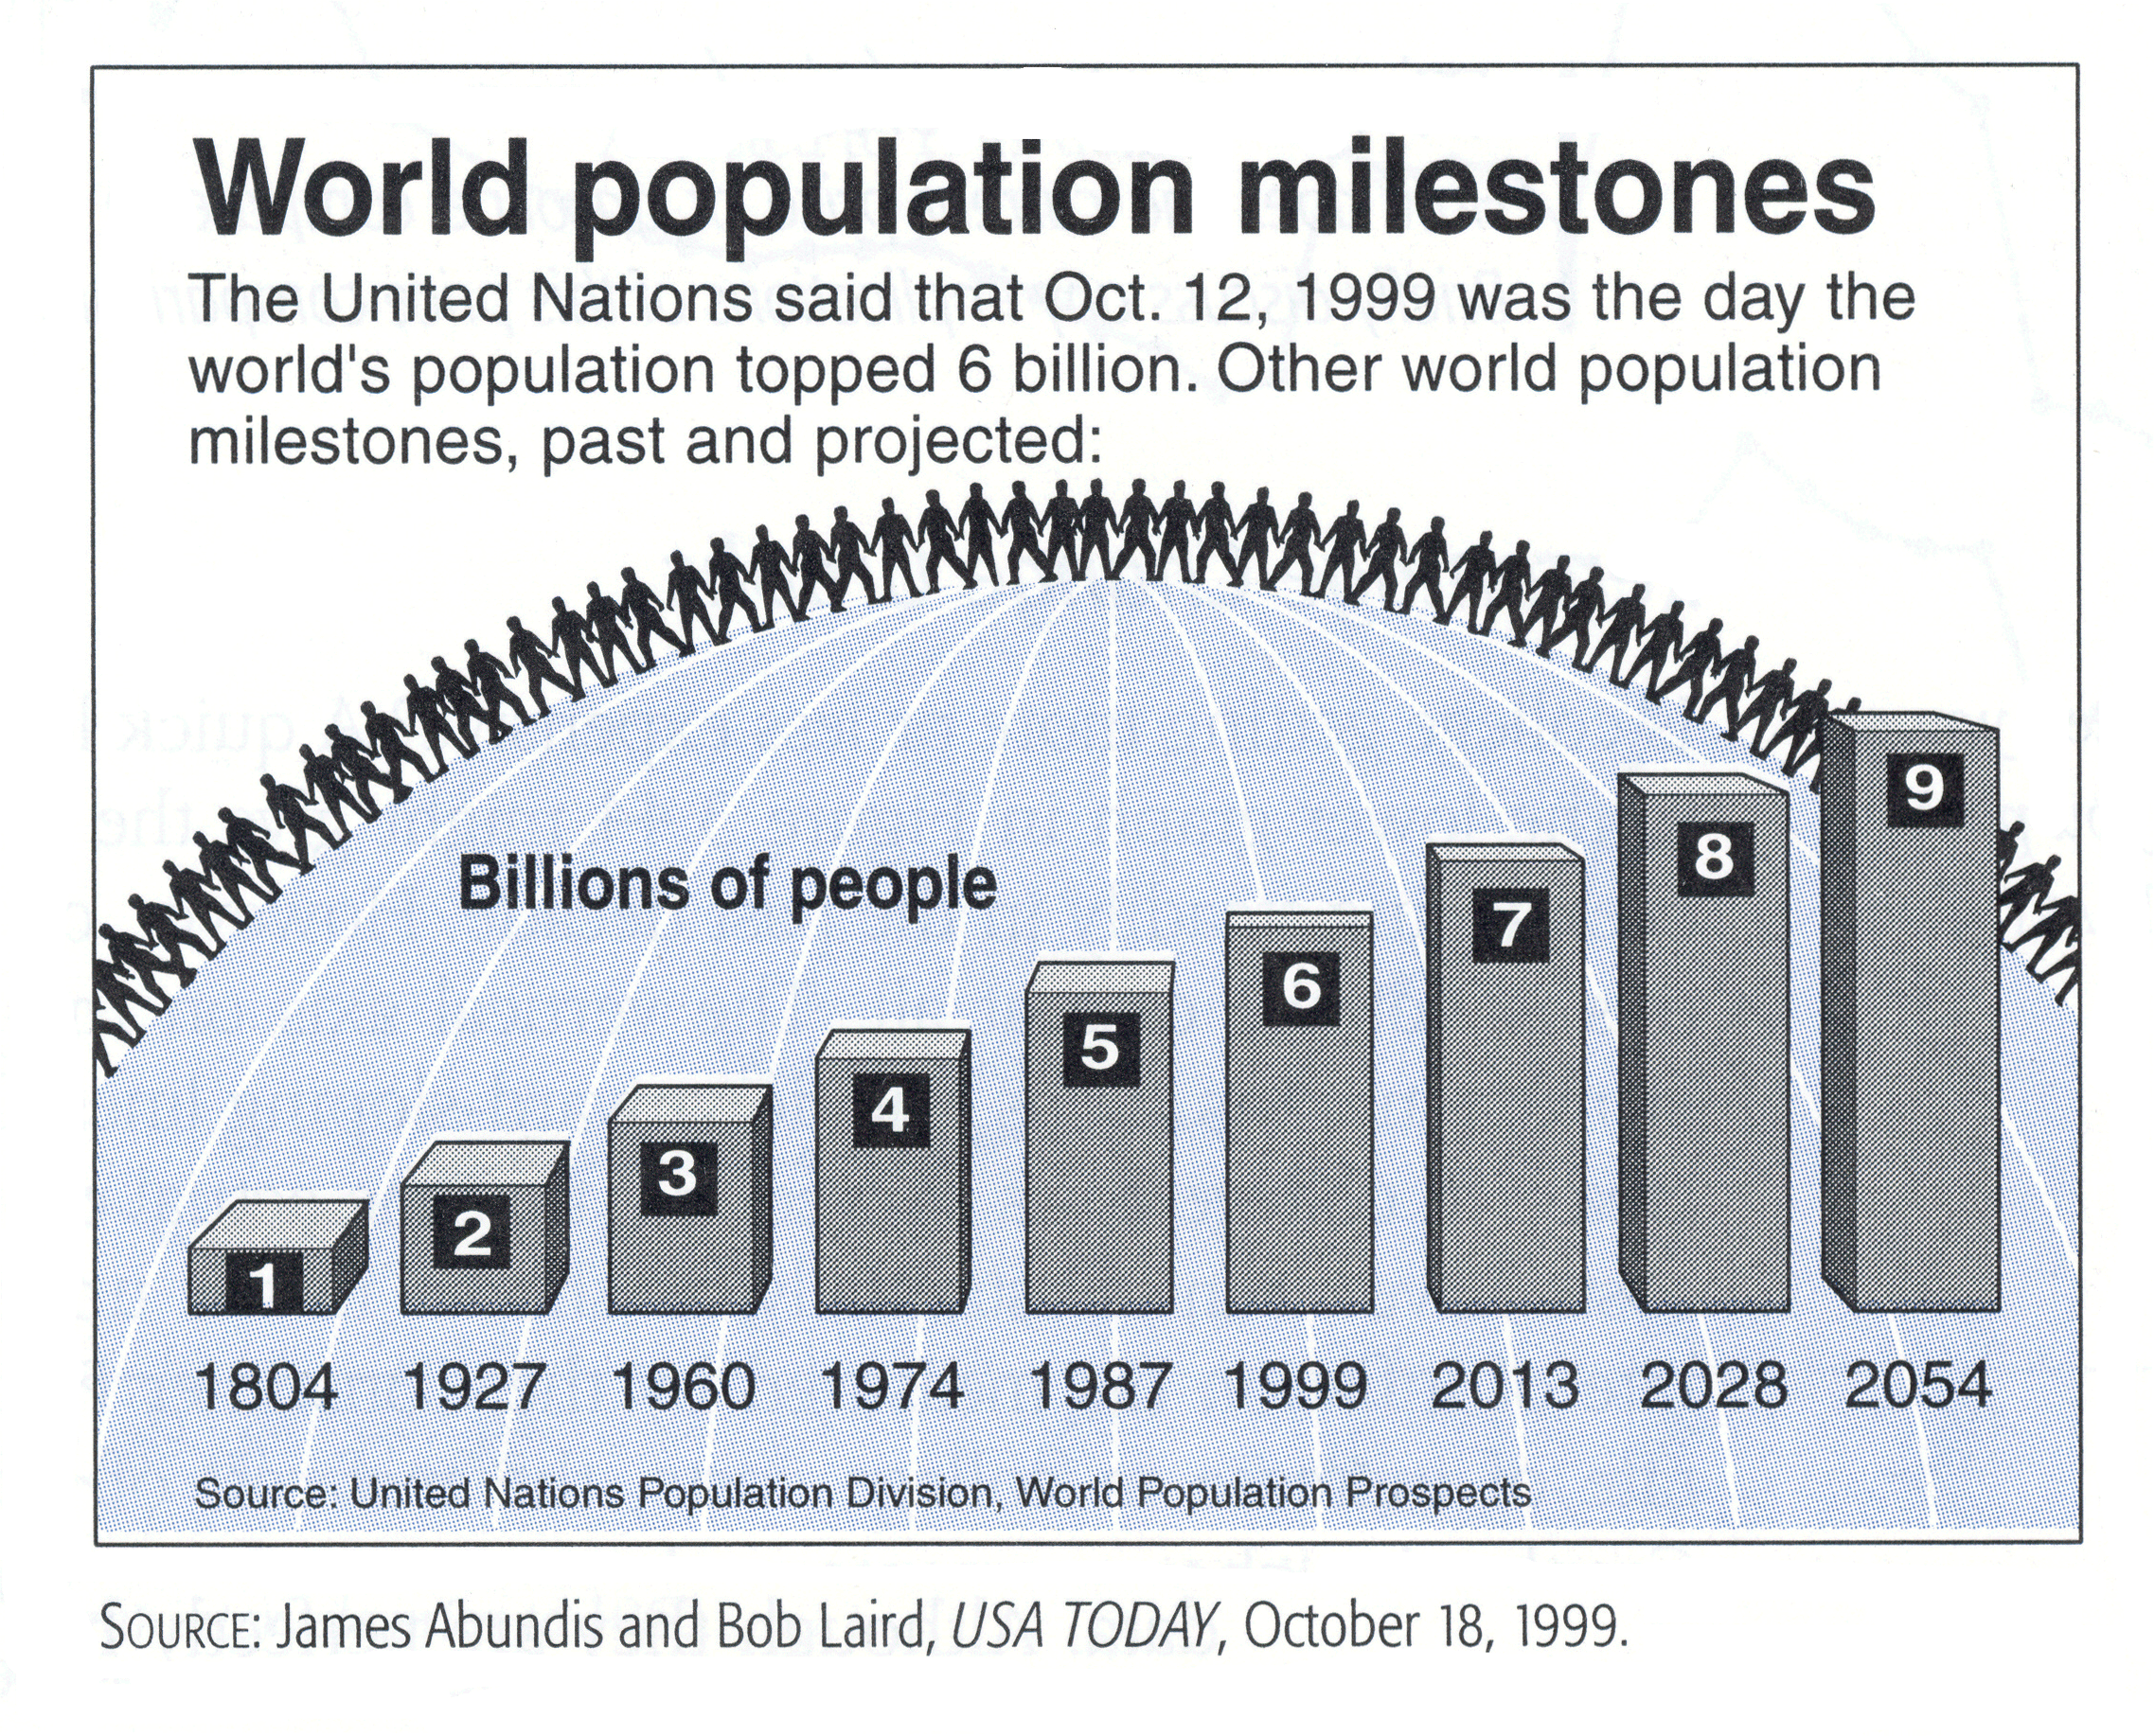
4. Critique the following graph:


