LSP 120 Final Review
Linear Modeling
a. Make an XY scatter plot of the data. Include it in your document. Add a linear trendline to your plot, including the equation and the R-squared value.
b. Use the linear equation (and slope and intercept functions on Excel) to predict the amount of tobacco produced in 2002.
| Tobacco Produced in the US | ||||
| [In billions of lbs] | ||||
| Year | Tobacco Produced (billions lbs) | |||
| 1975 | 2.2 | |||
| 1980 | 1.8 | |||
| 1982 | 2.0 | |||
| 1984 | 1.7 | |||
| 1986 | 1.5 | |||
| 1987 | 1.2 | |||
| 1988 | 1.2 | |||
| 1989 | 1.4 | |||
| 1990 | 1.6 | |||
| slope | -0.05903 | |||
| intercept | 118.7743 | |||
| y | 0.592444 | |||
-.059*2002 +118.77 = .5924 billion pounds (shows the prediction algebraically)
c. How much confidence do you have in your prediction? Write at least three sentences justifying your prediction including a lead sentence, at least two supporting sentences and any items that that must be pointed out (if applicable).
Based on data from 1975 through 1990, I predict that 592.4 million pounds of tobacco will be produced in 2002. I am fairly confident in my prediction for a number of reasons. My data includes more than seven data points and there are no significant outliers. My R-squared is 0.7011 and it suggests a moderate to strong linear relationship. In addition because of societal pressures an the numerous health risks (which will continue to make the news), I believe that the consumption of tobacco products will continue to decline. The only reservation I have with respect to this prediction is that the last three years on data seems to indicate an increase in tobacco production which visually does not match the negative direction of the trendline. Never the less, I still believe that all criteria for support a trend that should decline in the long run.
Exponential Modeling and Solving Exponential Equations
2. Carbon dioxide emissions from the burning of fossil fuels is almost surely a cause of global warming. One of the difficulties in negotiating a treaty for the reduction of carbon dioxide emissions is the discrepancy in emission levels between developing and developed nations. For example, in 1999, Brazil emitted 89 million metric tons of carbon into the atmosphere, while Canada, a much less populous country, emitted 151 million metric tons. Brazil’s emissions, however, are growing at 4.1% per year, while Canada’s are growing at 0.8%.
a. In Excel, make a table and using what you learned about exponential growth (percent increase), calculate when Brazil’s emissions will exceed Canada’s. Paste your table on your word document.
| year | Canada's CO2 emission (million metric tons) | Canada's emission rate | Brasil's CO2 emission (million metric tons) | Brasil's emission rate |
| 1999 | 151 | 89 | ||
| 2000 | 152.208 | 0.008 | 92.649 | 0.041 |
| 2001 | 153.425664 | 0.008 | 96.447609 | 0.041 |
| 2002 | 154.6530693 | 0.008 | 100.401961 | 0.041 |
| 2003 | 155.8902939 | 0.008 | 104.5184414 | 0.041 |
| 2004 | 157.1374162 | 0.008 | 108.8036975 | 0.041 |
| 2005 | 158.3945155 | 0.008 | 113.2646491 | 0.041 |
| 2006 | 159.6616717 | 0.008 | 117.9084997 | 0.041 |
| 2007 | 160.938965 | 0.008 | 122.7427482 | 0.041 |
| 2008 | 162.2264768 | 0.008 | 127.7752008 | 0.041 |
| 2009 | 163.5242886 | 0.008 | 133.0139841 | 0.041 |
| 2010 | 164.8324829 | 0.008 | 138.4675574 | 0.041 |
| 2011 | 166.1511428 | 0.008 | 144.1447273 | 0.041 |
| 2012 | 167.4803519 | 0.008 | 150.0546611 | 0.041 |
| 2013 | 168.8201947 | 0.008 | 156.2069022 | 0.041 |
| 2014 | 170.1707563 | 0.008 | 162.6113852 | 0.041 |
| 2015 | 171.5321223 | 0.008 | 169.278452 | 0.041 |
| 2016 | 172.9043793 | 0.008 | 176.2188685 | 0.041 |
Brazil’s emissions will exceed Canada’s in 2016.
b. How much confidence you have in your prediction in a?
I have only moderate confidence. 17 years is quite far from the existing data. On the other hand, I have complete confidence that Brazil’s emissions will exceed Canada’s in the not so distant future. I am not sure that Brazil will be able to keep up a 4.1% annual rate of percentage increase for so long.
c. Find formula for the exponential function which models Brazil’s emissions (using 1999 as year 0).
Y = 89 * (1+0.041)x
d. Using the formula for Brazil’s model, predict Brazil’s emissions in 2010.
Y = 89 * (1+0.041)x where x= 2010-1999= 11
Y= 89 * (1+ 0.041)11 = 138.5 metric tons.
3. In 1994, some samples from the archeological site at Oslonki, Poland were dated using carbon 14. The archeological site is significant for the large quantities of copper implements and jewelry found there. One of the samples had 47.8% of the carbon 14 that would normally be present in a living organism. (Carbon 14 decays approximately 1.202% every 100 years.)
a. Using Excel calculate the approximately how old the sample is. Paste the Excel table you used to calculate your answer.
| year | Carbon 14 | rate of decay |
| 0 | 100 | |
| 100 | 98.798 | -0.01202 |
| 200 | 97.61045 | -0.01202 |
| 300 | 96.43717 | -0.01202 |
| 400 | 95.278 | -0.01202 |
| 500 | 94.13275 | -0.01202 |
| . | . | . |
| . | . | . |
| . | . | . |
| . | . | . |
| 6100 | 47.82306 | -0.01202 |
| 6200 | 47.24822 | -0.01202 |
The sample is between 6100 - 6200 years old.
b. Using logs calculate the exact age of the sample. Show your calculation.
Y= P *(1+r)x
where Y= 47.8, P= 100, r= -0.01202, solve for x
47.8 = 100*(1+ -0.01202)x
47.8/100 = (0.98798)x
0.478 = 0.98798x now apply the following log property if a= bx , then log (a) = x*log (b)
log (0.478) = x* log (0.98798)
log(0.478)/ log (0.98798) = x = 61.04 => unit of decay is every 100 years
61.04 * 100 = 6104
The sample is 6104 years old.
4. In 1990, the population of the town Erehwon was 5000 and has been increasing by 2.9% every year. The population of the town Exalpon, Erehwon’s nearest neighbor, was 4500 and increasing by 3.2% every year. When, will the population of Exalpon exceed Erehwon? (Paste your Excel Table)
| Year | Erehwon | % of population increase (in decimal) | Exalpon | % of population increase (in decimal) |
| 0 | 5000 | 4500 | ||
| 1 | 5145.00 | 0.029 | 4644.00 | 0.032 |
| 2 | 5294.21 | 0.029 | 4792.61 | 0.032 |
| 3 | 5447.74 | 0.029 | 4945.97 | 0.032 |
| 4 | 5605.72 | 0.029 | 5104.24 | 0.032 |
| 5 | 5768.29 | 0.029 | 5267.58 | 0.032 |
| 6 | 5935.57 | 0.029 | 5436.14 | 0.032 |
| 7 | 6107.70 | 0.029 | 5610.10 | 0.032 |
| 8 | 6284.82 | 0.029 | 5789.62 | 0.032 |
| 9 | 6467.08 | 0.029 | 5974.89 | 0.032 |
| 10 | 6654.63 | 0.029 | 6166.08 | 0.032 |
| 11 | 6847.61 | 0.029 | 6363.40 | 0.032 |
| 12 | 7046.19 | 0.029 | 6567.03 | 0.032 |
| 13 | 7250.53 | 0.029 | 6777.17 | 0.032 |
| 14 | 7460.80 | 0.029 | 6994.04 | 0.032 |
| 15 | 7677.16 | 0.029 | 7217.85 | 0.032 |
| 16 | 7899.80 | 0.029 | 7448.82 | 0.032 |
| 17 | 8128.89 | 0.029 | 7687.19 | 0.032 |
| 18 | 8364.63 | 0.029 | 7933.18 | 0.032 |
| 19 | 8607.20 | 0.029 | 8187.04 | 0.032 |
| 20 | 8856.81 | 0.029 | 8449.02 | 0.032 |
| 21 | 9113.66 | 0.029 | 8719.39 | 0.032 |
| 22 | 9377.96 | 0.029 | 8998.41 | 0.032 |
| 23 | 9649.92 | 0.029 | 9286.36 | 0.032 |
| 24 | 9929.77 | 0.029 | 9583.52 | 0.032 |
| 25 | 10217.73 | 0.029 | 9890.20 | 0.032 |
| 26 | 10514.04 | 0.029 | 10206.68 | 0.032 |
| 27 | 10818.95 | 0.029 | 10533.30 | 0.032 |
| 28 | 11132.70 | 0.029 | 10870.36 | 0.032 |
| 29 | 11455.55 | 0.029 | 11218.21 | 0.032 |
| 30 | 11787.76 | 0.029 | 11577.20 | 0.032 |
| 31 | 12129.60 | 0.029 | 11947.67 | 0.032 |
| 32 | 12481.36 | 0.029 | 12329.99 | 0.032 |
| 33 | 12843.32 | 0.029 | 12724.55 | 0.032 |
| 34 | 13215.78 | 0.029 | 13131.74 | 0.032 |
| 35 | 13599.04 | 0.029 | 13551.95 | 0.032 |
| 36 | 13993.41 | 0.029 | 13985.62 | 0.032 |
| 37 | 14399.22 | 0.029 | 14433.16 | 0.032 |
In 37 years.
Trendlines and Graphs
5. Below is a trendline graph of the number cellular telecommunications subscribers from 1994 - 2003.
a. Based on what you learned about creating effective graphs, list two concerns about the above graph.
the source is not listed
the title does not address the 4-Ws - What/Who, When, Where
b. Predict when there were no cell phone subscribers? (Since you do not have the data, use the slope and intercept that is given to you in the formula in the graph to calculate your answer)
Y= MX+B
Y= 0, M= 15522.1091, B= -30935947.8182, solve for X:
0 = 15522.1091*X+-30935947.8182
30935947.8182 = 15522.1091*X
30935947.8182 / 15522.1091 = 1993.025 = X
I predict that there were no cell phone subscribers in the year 1993.
c. How much faith do you have in your prediction?
Based on the data from 1994 through 2003, there were no cell phones in 1993. Using my knowledge about cell phones, the equation is not a good fit for the data (when predicting backwards) because there were cell phones in 1993.(really big ones: see below)
d. Using your equation, predict the number of subscribers in 2030.
Y= MX+B
X= 2030, M= 15522.1091, B= -30935947.8182, solve for Y:
Y = 15522.1091*2030+-30935947.8182
Y= 573,933.7 since the unit for the no. of subscribers are in thousands (look at the Y axis label):
Y= 573,933.7 * 1000 =
I predict that there will be 573,933,700 cell phone subscribers in the year 2030.
e. How much faith do you have in your prediction?
I predict that there will be 573,933,700 cell phone subscribers in the year 2030. Once again, practical knowledge dictates whether or not we have faith in the prediction. Since technology changes so quickly, 2030 is too far out for a prediction. Also, 573,933,700 far exceeds the current U.S. population. So I do not have confidence in this prediction.
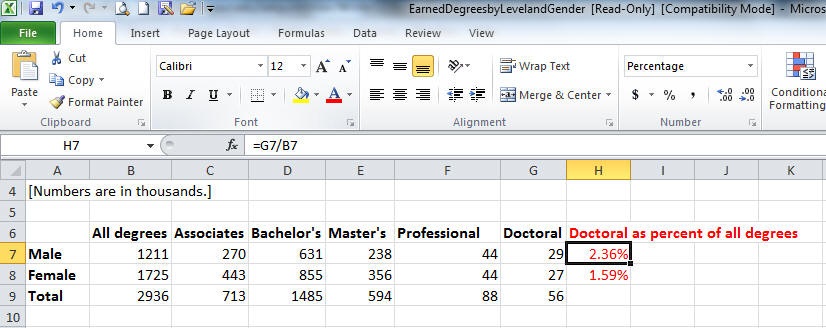
6. Open the file EarnedDegreesbyLevelandGender.xls which contains data on degrees conferred in 2006.
a. Make a single graph to answer this question: In 2006 what percentage of all degree-earning males and what percentage of all degree-earning females earned a Doctoral degree?
I can see that this question can be answered with a bar chart. This is because it is asking me to graph percentages of doctoral degrees from two different and distinct categories: all degree-earning males and all degree earning females. First I have to calculate the percentages for each of these categories. So, in the Excel file, I divide the number of doctoral degrees will total number of degrees for males, and I do the same for females.
I then select genders and the calculated percentage to make the following graph.
The graph above tells us that in 2006, only 2.36% of all degree-earning men, and only 1.59% of all degree-earning women earned Doctoral degrees.
b. Make a single graph to answer this question: In 2006 what percentage of all those receiving a Doctoral degree were female and what percentage were male?
I can see that the Pie Chart is the best way to answer this question. This is because the question is asking me to visually represent two distinct parts of a whole: percent of all doctoral degree recepients that are male and percent that are female. I already have the values in the chart to make this graph. I select the number of male and female doctoral degree recipients and the male and female gender categories (highlighted in blue below) to make my pie chart.

The graph below tells us that in 2006 51.07% of all those receiving a Bachelor's degree were male, and 48.93% were female.
Percentages and Rates
7. The following table list the 2009 average circulation of ten magazines with the largest circulation in the US.
| Magazine | 2009 Circulation |
| AARP The Magazine | 24,554,819 |
| AARP Bulletin | 24,305,715 |
| The Costco Connection | 8,217,269 |
| Reader's Digest | 8,158,652 |
| Better Homes and Gardens | 7,634,197 |
| Food & Family | 6,440,891 |
| National Geographic | 4,708,307 |
| Good Housekeeping | 4,630,397 |
| Woman's Day | 3,933,990 |
| Family Circle | 3,932,510 |
a. How many times larger is the circulation of AARP The Magazine greater than the circulation of National Geographic?
Answer. The circulation of AARP The Magazine is 5.22 times larger than the circulation of National Geographic. The calculation is 24,554,819/4,708,307 » 5.22.
b. By what percent the circulation of Reader's Digest is larger than the circulation of Family Circle?
Answer. The circulation of Reader's Digest is 107% larger than the circulation of Family Circle. The calculation is (8,158,652 - 3,932,510)/3,932,510 » 1.07 = 107%.
c. The magazine that had the largest circulation in the United Kingdom was the entertainment magazine Skymag. Its 2009 circulation was 7,545,510. By how many percent is its circulation larger than the circulation of the National Geographic?
Answer. Skymag has a circulation 60% larger than National Geographic. The calculation is (7,545,510 - 4,708,307)/4,708,307 » .60 = 60%.
d. In 2005 the magazine TV Guide was ranked 4th in the nation with a circulation of 8,211,581. Just four years later it had fallen to 22nd place with a circulation of 2,934,969. By how many percent did the circulation drop from 2005 to 2009?
Answer. The circulation of TV Guide dropped 64%. The calculation is (2,934,969 -8,211,581)/8,211,581 » .64 = 64%.
8. In the period January 2000 to March 2000, stock for Sapient Corporation, a consulting company that helps businesses put their operations on the internet, dropped 51% and then rose by 49%. By how many percent did price change over the whole period?
Answer. Successive percents.
Formula: (1+/- r1)*(1+/- r2)-1= overall percent change
r1 = -51% = -0.51
r2 = 49% = 0.49
(1-0.51)*(1+0.49) - 1= -0.2699 --> The over all percent change was -26.99%. The stock for Sapient Corporation decreased by 26.99% from January 2000 to March 2000.
Alternate way of calculation:
Starting at 100%, the stock dropped to 49% of its original value. It then increase by 49% of the 49%, i.e., 0.49*0.49 = 0.2401 or 24.01% of the original price. Thus in the end it was 49% + 24.01% or 73.01% of its original value. It was down 26.99%.
9. Cigarette use in the US has decreased over the last 20 years, even though the rate is still relatively high. In 1998, 277 of every 1000 individuals in the US over the age of 12 reported that they were smoking, a 28% decrease since 1985. What was the rate in 1985?
Answer.
x - (0.28*x) = 277
x*(1 - 0.28) = 277
x(0.72) = 277
x = 277/0.72 » 385
The answer is approximately 385 of every 1000 individuals over the age of 12.
10. At DePaul University, minority students represented 31% of the enrollment in 2001. If there were 21,363 students enrolled in 2001, about how many of these students are minority students?
6622.53 or about 6622 students
11. Chicago’s population grew from 2.78 million in 1990 to 2.90 million in 2000. By how many percent did it grow?
4.3% increase
12. The January 14, 2002 issue of TIME magazine reported that Wal-Mart’s 3rd quarter revenues for 2001 were 600% more than its No. 2 competitor, K-Mart. What were K-Mart’s revenues during this period if Wal-Mart’s revenues were $48 billion?
$6.86 billion
13. In 2006, 261.9 million people in the United States were born in the United States, and the rest, 37.5 million were foreign born. What percentage of the population of the US was foreign born?
12.5% foreign born
14. Over the last four years, DePaul’s freshman class has grown by 4.8%. What is the Fall 2005 freshman enrollment if the 2009 enrollment was 3,041 students?
2902 students
15. In 2001, 6,113 applicants were accepted to DePaul. This represents about a 72% acceptance rate. Of the students who were accepted, 2,050 students enrolled at the university.
a. How many students in 2001 applied for admission at DePaul?
8490 students applied
b. What percent of the students who were accepted to DePaul actually enrolled at the University?
33.54% of students who were accepted enrolled
16. The November 16, 2009 issue of the New York Times reported that there were 671,616 foreign students enrolled at US colleges and universities in 2008-09 — representing an 8% increase from the previous year. It was the largest percentage increase in more than 25 years.
a. How many foreign students were studying in US colleges and universities during 2007-2008?
621,867 foreign students
b. The greatest number (103,260) of foreign students came from India. What percent of the foreign students studying in the US were from India?
15.37% from India
c. China currently has the second largest number of foreign students studying in the US, however they are rapidly catching up to India. The number of foreign students from China in 2007-2008 was 81,413. That number grew by 21% over the next year. How many foreign students were from China during 2007-2008?
98,510 from China in 2007-2008
17. The December 11, 2002 issue of Sports Illustrated reported that the federal spending for Olympic Games held in the United States was $610 million for the 1996 Atlanta Games and $1.5 billion for the 2002 Salt Lake City Games. (The figures have been adjusted for inflation.)
a. How many times more federal money was spent on the Salt Lake City Games than the Atlanta Games?
2.46 times more
b. By what percent is the federal spending for the Salt Lake City Games more than the Atlanta Games?
146%
c. By what percent is the federal spending for the Atlanta Games less than the Salt Lake City Games?
-59.33%
Consumer Price Index
18. Carefully describe a) what the CPI is, b) how it is constructed, and c) what the meaning of actual index numbers is (e.g., the CPI in 1999 was 166.6; what does 166.6 mean?)
The CPI is number used to measure the changing value of money over time. It is published by the US Bureau of Labor Statistics. Economists select an imaginary "market basket" of goods and services that represents the buying patterns of most people. Every month they collect price data on the items in the basket and essentially compute the value of the entire basket. The CPI is literally the ratio of the price of the basket in a given year to the price of the basket in a chosen base period multiplied by 100. For example, the 166.6 CPI in 1999 means that the price of the standard market basket is 1.666 times as much as it was in the base period (1982-84). It means that in 1999 the same goods and services cost about 66.6% more than they did in 1982-84. Another interpretation of the index number 166.6 is the following: a person would have to pay $166.60 to buy the same goods and services that a person could buy for $100.00 in the base period on average. For more information, read the CPI Tutorial.
19. Open the Defense.xls file. this file contains the data on U.S. spending for national defense for fiscal years between 1960 and 2002.
a. Using the CPI, add a column to the table in which you calculate defense spending for these years in constant 2002 dollars, and cut and paste the table into your word document.
You need to paste in the CPI values in column C. The needed Excel formula in column D is =B5*179.9/C5 or =B5*$C$47/C5. The top of the table is:
| Year | Spending | CPI | Spending in 2002$ |
| 1960 | 53.5 | 29.6 | 325.2 |
| 1961 | 55.3 | 29.9 | 332.7 |
| 1962 | 57.9 | 30.2 | 344.9 |
| 1963 | 58.9 | 30.6 | 346.3 |
| 1964 | 60.5 | 31.0 | 351.1 |
| 1965 | 56.3 | 31.5 | 321.5 |
| 1966 | 64.1 | 32.4 | 355.9 |
| 1967 | 78.1 | 33.4 | 420.7 |
| 1968 | 88.9 | 34.8 | 459.6 |
| 1969 | 90.2 | 36.7 | 442.2 |
| 1970 | 90.4 | 38.8 | 419.1 |
b. Create an XY graph showing spending in constant 1999 dollars for the period 1960-2002.
c. In a well written paragraph describe the graph you made in c.
Defense spending was about 300 billion dollars in 1960. It rose slightly in the early Sixties before dropping to it absolute minimum during the period 297 billion in 1965. It then rose dramatically, achieving a local maximum of 426 billion in 1968, the height of the Vietnam War. Defense dropped fairly rapidly from 1968 until 1974. It then remained fairly constant (at about the 320 billion level) until 1981. During the Reagan administration in the early Eighties, defense spending shot up, and defense spending was at it highest point in the entire period in 1986 (456 billion). Spending leveled off a bit in the late Eighties but then plunged in the Nineties. In the late 1990s, it remained relatively constant. After 9/11/2001, defense spending increased dramatically. The overall picture shows two massive arms buildups, one corresponding to the Vietnam War and the other to the Reagan Administration's Strategic Defense Initiative and other Cold War efforts. We are perhaps at the start of another arms buildup.
20. According to the Defense.xls file, spending for national defense in 1985 was $279 billion and in 2002 it was $399.5 billion.
a. Discuss why you cannot conclude that the spending on defense increased in value from 1985 to 2002.
Since the value of the dollar decreases over time due to inflation, it is hard to compare spending from 1985 to 2002. You cannot conclude that the actual dollars spent increased that the value of the spending increased. The value of the dollar is not the same in both years.
b. Using the information in CPI.xls, convert the 1985 actual spending to 2002 constant dollars. Compare this value to the actual 2002 spending. What does it tell you about defense spending over these years.
new CPI/old CPI * old actual $ = 179.9/107.6*279 = 466.5. 1985 spending in 2002 constant dollars is $466.5 billion. This is much higher than the actual spending in 2002. This means defense spending grew less than inflation over the 17 years. Defense spending was very high in the mid-1980's.
c. The 2002 constant dollar value of the 1985 spending is what percent larger than the actual spending in 2002?
(466.5-399.5)/399.5 = 16.7%
Loans
21. You have decided to buy a 2003 Chevy Cavalier. The total cost with tax, title, license and optional equipment is $20,500. You will make a down payment equal to 10% of the total cost of the car. The remaining amount will be financed.
You have two financing options.
Option 1 - Get $2,500 cash back. This amount will reduce the amount you need to finance. You will be able to get a 5 year car loan on the remaining amount with a 6.0% interest rate from your bank.
Option 2 - Get no cash back and finance the entire amount. The loan will be for 3 years with a 0.0% interest rate from GMAC financing.
a. What is the amount of money that you will need to borrow under Option 1?
$15,950
b. Make an amortization table for Option 1 and verify
that your ending balance after 60 months is zero. Paste
the first five lines (months 0 - 4) in your Word
document. What is your monthly payment? What is the total
amount paid over the term on the loan?
| Month | Beg Balance | Payment | Interest | Principal | End Balance |
| 0 | 15950 | ||||
| 1 | 15950 | $308.36 | 79.75 | $228.61 | $15,721.39 |
| 2 | 15721.39182 | $308.36 | 78.607 | $229.75 | $15,491.64 |
| 3 | 15491.64059 | $308.36 | 77.458 | $230.90 | $15,260.74 |
| 4 | 15260.74061 | $308.36 | 76.304 | $232.05 | $15,028.69 |
My monthly payment is $308.76, the total amount paid over the term on the loan is $18,501.49
c. How much will you need to borrow if you choose option
2? What is your monthly payment?
| Month | Beg Balance | Payment | Interest | Principal | End Balance |
| 0 | 18450 | ||||
| 1 | 18450 | $512.50 | 0 | $512.50 | $17,937.50 |
| 2 | 17937.5 | $512.50 | 0 | $512.50 | $17,425.00 |
| 3 | 17425 | $512.50 | 0 | $512.50 | $16,912.50 |
| 4 | 16912.5 | $512.50 | 0 | $512.50 | $16,400.00 |
If I choose option 2, I need to borrow $18,450; my monthly payment will be $512.50
d. Which financing option should you choose and why? Explain.
In terms of the amount that comes out of my pocket the two options are almost identical. Option 1 has me paying $18,501.49 over the term of the loan, and option 2 makes me borrow $18,450 but with zero interest so I only pay that amount back. With option 1 my monthly payments are lower but it takes 5 yrs to pay it off. With option 2 my monthly payments are higher but it takes me only 3 years to pay it off. So if I can afford it I would take option 2, so that I am done with the debt sooner.
Credit Cards
22. You only use your credit card in the case of an emergency. You charge $4,000 in auto repairs to credit card which has an annual interest rate of 11.99% (Assume you make no additional charges on the card). You want to pay off your balance in full after two years. What should your monthly payment be?
$188.28
| Month | Beg Balance | Payment | Interest | Principal | End Balance |
| 0 | 4000 | ||||
| 1 | 4000 | $188.28 | 39.9666667 | $148.31 | $3,851.69 |
| 2 | 3851.69 | $188.28 | 38.4848171 | $149.79 | $3,701.90 |
| 3 | 3701.9 | $188.28 | 36.9881615 | $151.29 | $3,550.61 |
| 4 | 3550.61 | $188.28 | 35.4765517 | $152.80 | $3,397.82 |
| 5 | 3397.82 | $188.28 | 33.9498385 | $154.33 | $3,243.49 |
| 6 | 3243.49 | $188.28 | 32.4078708 | $155.87 | $3,087.62 |
| 7 | 3087.62 | $188.28 | 30.8504963 | $157.42 | $2,930.20 |
| 8 | 2930.2 | $188.28 | 29.277561 | $159.00 | $2,771.20 |
| 9 | 2771.2 | $188.28 | 27.6889095 | $160.59 | $2,610.61 |
| 10 | 2610.61 | $188.28 | 26.0843847 | $162.19 | $2,448.42 |
| 11 | 2448.42 | $188.28 | 24.4638281 | $163.81 | $2,284.61 |
| 12 | 2284.61 | $188.28 | 22.8270794 | $165.45 | $2,119.16 |
| 13 | 2119.16 | $188.28 | 21.1739768 | $167.10 | $1,952.06 |
| 14 | 1952.06 | $188.28 | 19.504357 | $168.77 | $1,783.29 |
| 15 | 1783.29 | $188.28 | 17.8180549 | $170.46 | $1,612.83 |
| 16 | 1612.83 | $188.28 | 16.1149038 | $172.16 | $1,440.67 |
| 17 | 1440.67 | $188.28 | 14.3947354 | $173.88 | $1,266.79 |
| 18 | 1266.79 | $188.28 | 12.6573797 | $175.62 | $1,091.18 |
| 19 | 1091.18 | $188.28 | 10.9026648 | $177.37 | $913.80 |
| 20 | 913.803 | $188.28 | 9.1304175 | $179.14 | $734.66 |
| 21 | 734.658 | $188.28 | 7.34046246 | $180.93 | $553.72 |
| 22 | 553.724 | $188.28 | 5.53262277 | $182.74 | $370.98 |
| 23 | 370.981 | $188.28 | 3.70671976 | $184.57 | $186.41 |
| 24 | 186.413 | $188.28 | 1.86257293 | $186.41 | $0.00 |
23. You make a purchase for $3,501 on your credit card which
has an annual interest rate of 17.99%. If you pay the minimum payment of 2% per
month (not less than $25), what is your balance after 4 years, assuming you
make no other purchases with your credit card?
$ 2,751.22
| Month | Beg Balance | Payment | Interest | Principal | End Balance |
| 0 | 3501 | ||||
| 1 | 3501 | $70.02 | 52.485825 | $17.53 | $3,483.47 |
| 2 | 3483.47 | $69.67 | 52.2229585 | $17.45 | $3,466.02 |
| 3 | 3466.02 | $69.32 | 51.9614085 | $17.36 | $3,448.66 |
| 4 | 3448.66 | $68.97 | 51.7011685 | $17.27 | $3,431.39 |
| . | . | . | . | . | . |
| . | . | . | . | . | . |
| . | . | . | . | . | . |
| 47 | 2778.99 | $55.58 | 41.6616461 | $13.92 | $2,765.07 |
| 48 | 2765.07 | $55.30 | 41.4529907 | $13.85 | $2,751.22 |
24. You make a purchase for $2,723 on your credit card which has an annual interest rate of 15.99%. The credit card company offers a minimum payment of 3% per month (not less than $25). How many years will it take your balance to equal $19.21 assuming your make no other purchases with your credit card?
114 months
| Month | Beg Balance | Payment | Interest | Principal | End Balance |
| 0 | 2,723 | ||||
| 1 | 2723 | $81.69 | 36.283975 | $45.41 | $2,677.59 |
| 2 | 2677.59 | $80.33 | 35.6789397 | $44.65 | $2,632.95 |
| 3 | 2632.95 | $78.99 | 35.0839934 | $43.90 | $2,589.04 |
| 4 | 2589.04 | $77.67 | 34.4989678 | $43.17 | $2,545.87 |
| . | . | . | . | . | . |
| . | . | . | . | . | . |
| . | . | . | . | . | . |
| 113 | 67.7279 | $25.00 | 0.9024738 | $24.10 | $43.63 |
| 114 | 43.6303 | $25.00 | 0.58137427 | $24.42 | $19.21 |