|
|
Mathematical and Technological Literacy I |
|
1. Women in the United States continue to be paid less than men overall. Nationally, in 2007, the median weekly earnings of female full-time wage and salary workers totaled $614, while it was $766 for males. (Data is from the Bureau of Labor Statistics report http://www.bls.gov/cps/cpswom2007.pdf )
a. Fill in the blanks using the data:
In 2007, male full-time wage and
salary workers earned _________ % more than female full-time wage and salary
workers.
In 2007, female full-time wage and salary workers earned _________ % less than
male full-time wage and salary
workers.
b. What percent of male full-time wage and salary worker median weekly
earnings does the female median weekly earnings represent? (This
percentage is often called the women-to-men's earning ratio.)
c. Using the data above ($614 for females and $766 for males), make a bar chart that purposely exaggerates the difference between men and women. Paste it into your Word document.
d. Using the data above ($614 for females and $766 for males), make a bar chart that purposely makes the difference between men and women seem small. Paste it into your Word document.
e. In the spirit of the story of Goldilocks, make a graph of the data that you feel gives the most accurate, non-biased view of the difference between male an female wages.
2. In the Bureau of Labor Standard's report http://www.bls.gov/cps/cpswom2007.pdf, the authors include the following complex chart.

In a 5-7 sentence paragraph, carefully describe the graph. What do you want you audience to know about the data you graphed? Address the following questions in your paragraph:
3. Another graph found in the Bureau of Labor Standard's report http://www.bls.gov/cps/cpswom2007.pdf shows the following:

a. What type of graph is this graph?
b. True or False: The graph shows that women with bachelor's degree or higher earn more than men with bachelor's degrees or higher. Briefly explain your answer.
c. In a 5-7 sentence paragraph , carefully describe what this graph tells about changes in women's and men's earnings from 1979 to 2007. Address the following questions in your paragraph:
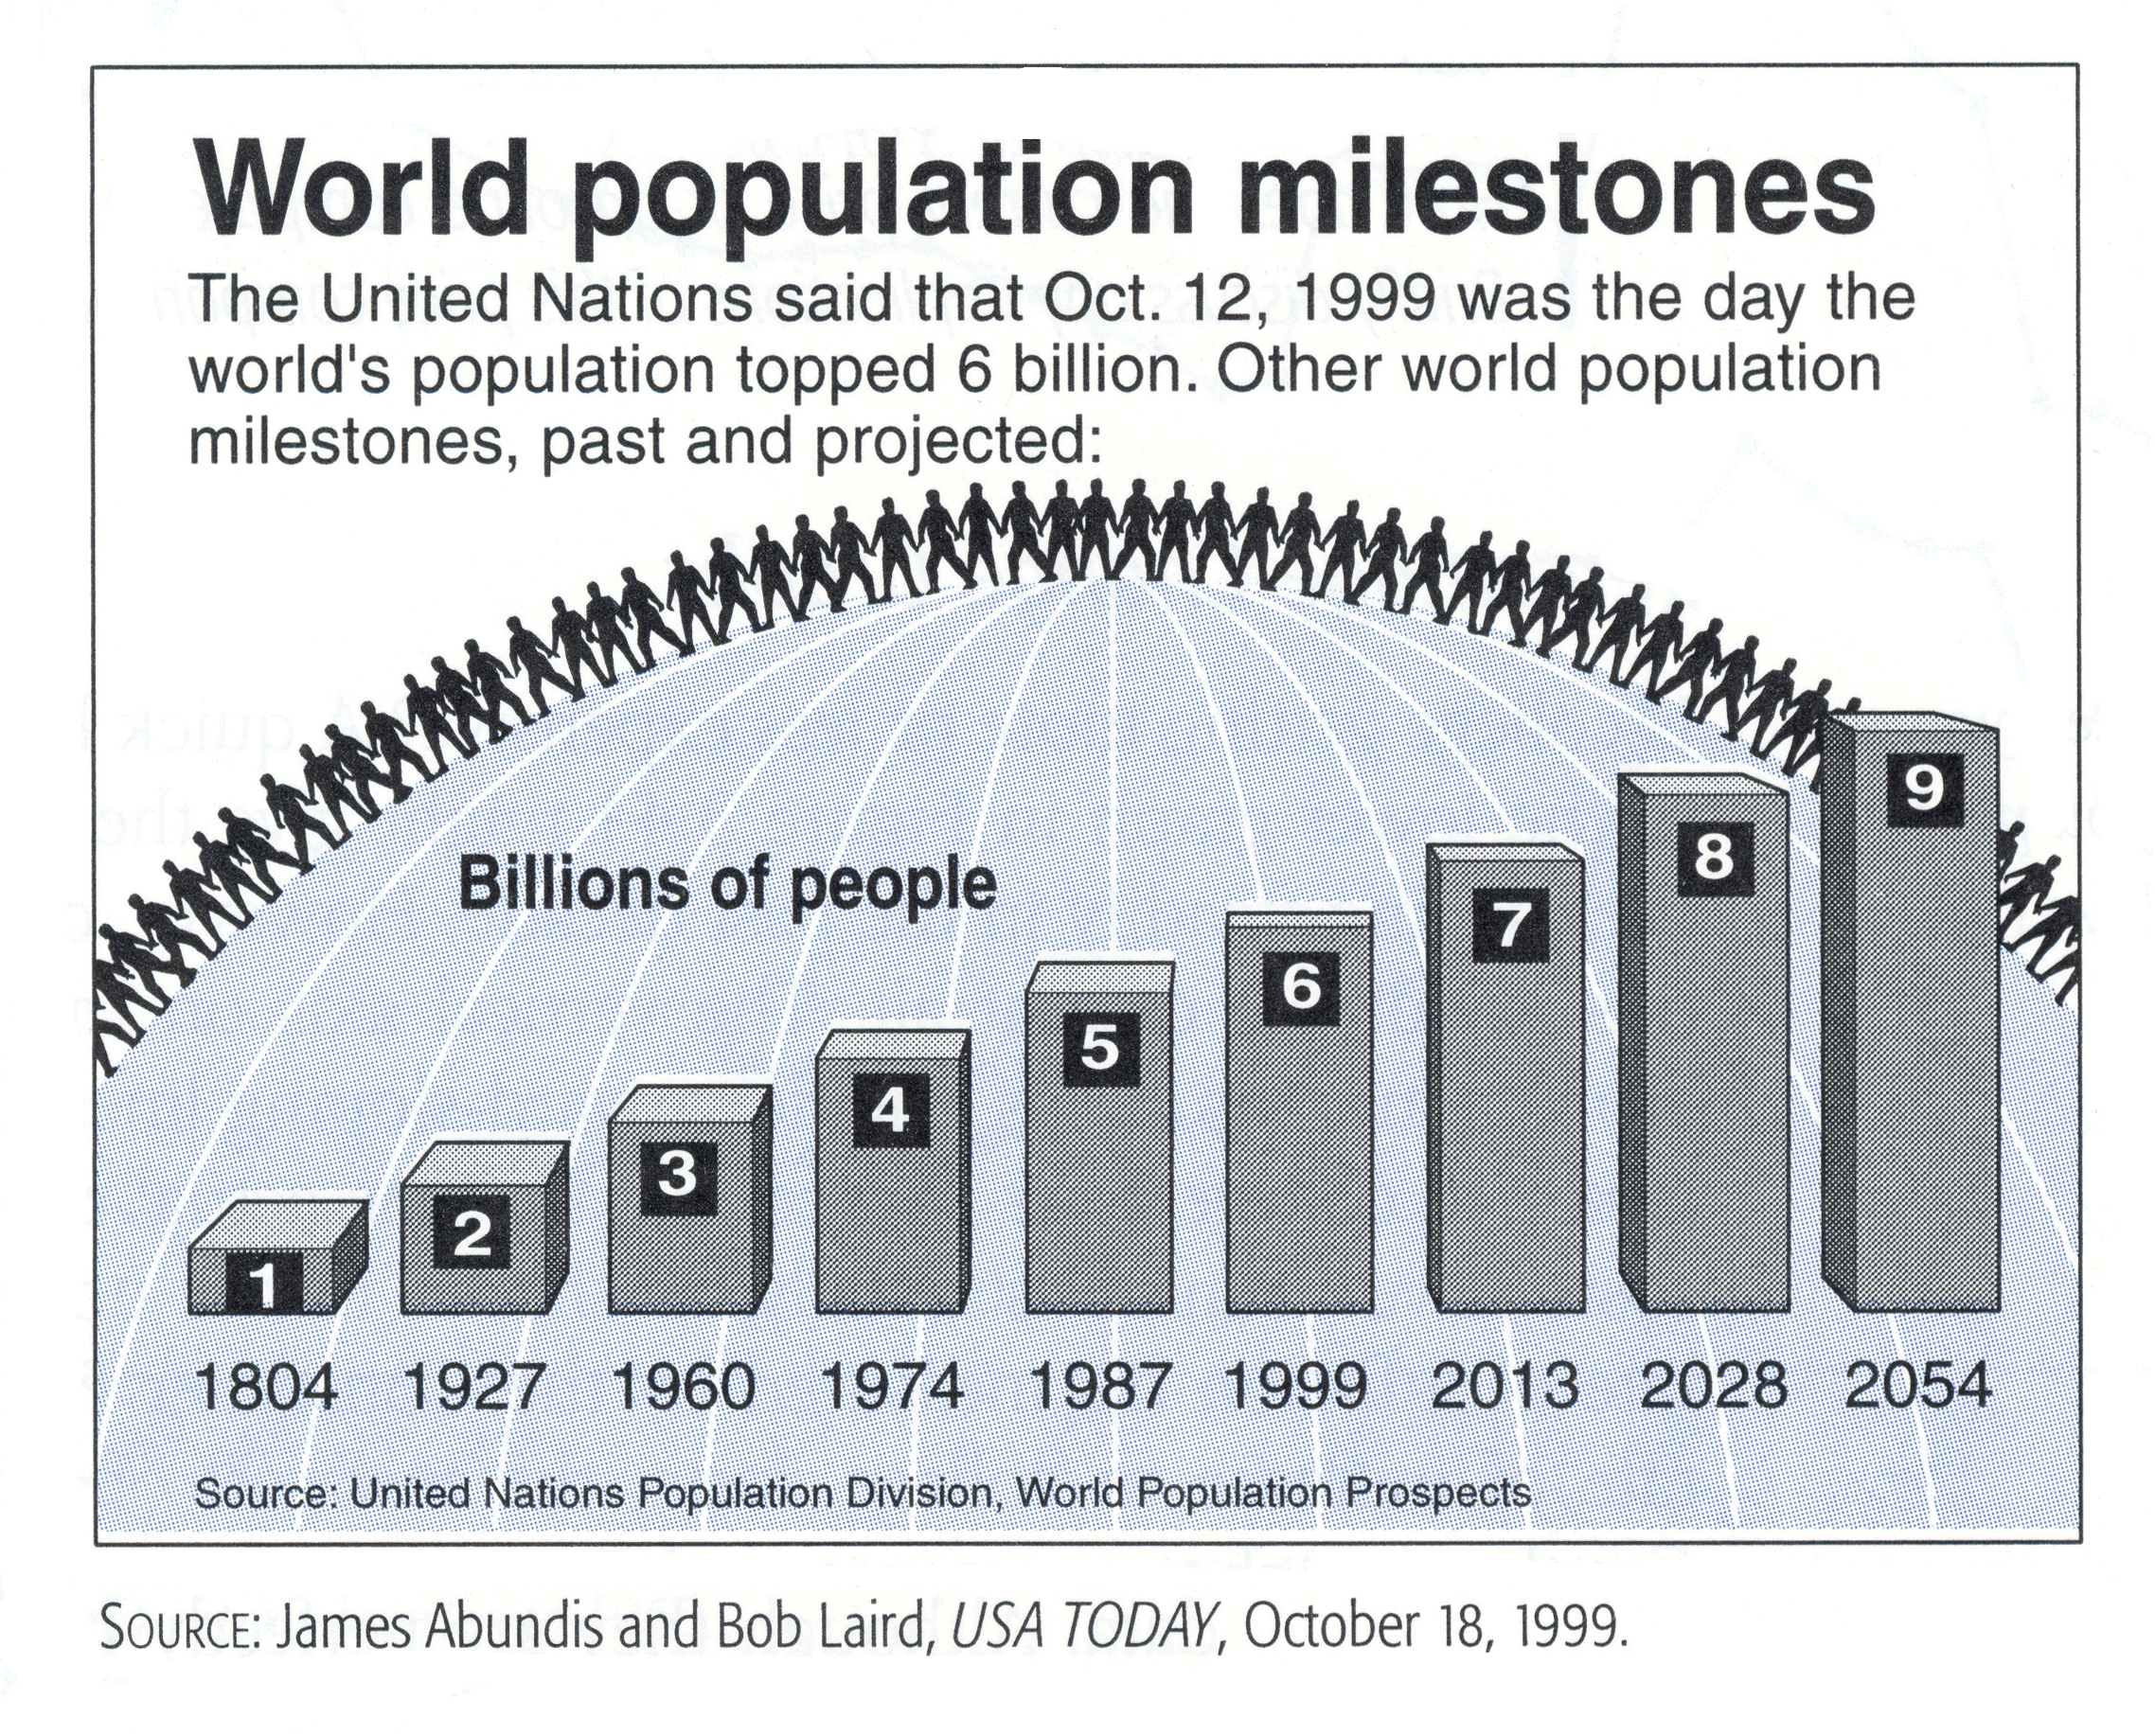
4. Critique the following graph:
