ISP 121 Activity 5
Fundamental Concepts of Probability and Simulation of Experiments using Excel
1. One of the distinctions we made in class is the difference between theoretical, relative frequency, and "personal" interpretations of probability. In this activity we will explore the difference between theoretical probability and relative frequency through simulation using Excel.
a. Before we start, discuss with your group member or group members whether the following statement is true or false:
"If you flip an unbiased coin many, many times, the number of heads and tails are close to equal."
In your Word document, write down your answer and very briefly indicate why in a short sentence.
b. Let us simulate flipping an unbiased coin in Excel. There are a number of ways of doing it, actually, but I am going to focus on a method that is quite versatile. We are going to us the Random Number Generation feature of the Data Analysis Tools.
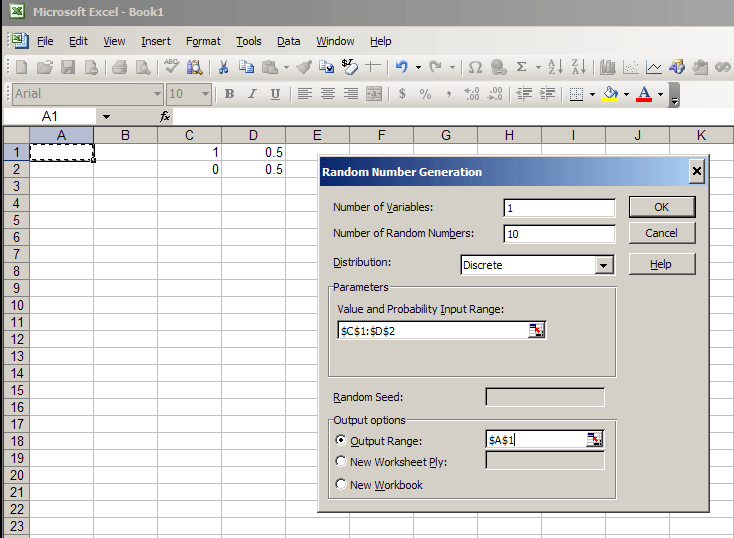
Open up Excel. Somewhere other than A1, type the following table into Excel:
| 1 | 0.5 |
| 0 | 0.5 |
In this table, we are setting up theoretical probabilities. "1" will represent heads, and "0" will represent tails. The theoretical probability for each is 0.5. (It would be nice if Excel would allow us to use "H" for heads and "T" for tails, but it doesn't.)
Next click on Tools->Data Analysis ->Random Number Generation. (Note if your version of Excel does not have the Data Analysis tools listed here, click on Tools->Add ins and then click the Analysis ToolPak. The Data Analysis tools will now appear in the Tools dropdown.)
For starters, we'll have 1 variable and 10 random numbers. Choose a "discrete" distribution, and choose the table you typed in as the "Value and Probability Input Range." Finally choose the output range to be cell A1. (Otherwise, Excel will put the data on another sheet which is not very convenient.) Here is what it will look like:
Click OK, and if all is well, you will have 10 random 0's and 1's, each of which appear with probability 0.5.
Paste into your Word document the 10 random flips, and in your Word document, answer the questions: did you get 5 heads and 5 tails? How many of each did you get?
c. Repeat part a with 100 random flips. With 100 flips it is already tedious to count how many 1's and 0's you got. While you could sort the column and I want to introduce you to a powerful command in Excel to count how many 1's and 0's you got. In cells somewhere type
=COUNTIF( range where the data is , 0)
and
=COUNTIF( range where the data is , 1)
where "range where the data is" refers to the range you would like to count. The COUNTIF command is very useful. As in part b) record how many heads and tails you got. Did you get the same number of each? How many more heads than tails (or vice versa) did you get?
d) Finally repeat the experiment for 1000, 10000, and 30000 flips. (Why do we stop at 30000? Because Excel for some reason unknown to me only goes up to 32767=215 − 1 simulations in a single column. We could go higher if used additional columns, but we won't right now.)
Fill in the following table using your data from parts b, c, and d. (Paste the table in your Excel workbook, fill it in, and finally paste it into Word document.) Remember the "relative frequency" of an event is
![]()
| Trials | Number of Heads (1's) | Number of Tails (0's) | Difference in number of heads and tails | Relative Frequency of Heads | Relative Frequency of Tails |
Ratio of Head to Tails |
| 10 | ||||||
| 100 | ||||||
| 1000 | ||||||
| 10000 | ||||||
| 30000 |
e) In a well-written paragraph, describe in your own words the patterns you see in the table. Does anything surprise you in the table?
f) Consider the following statement:
"If you flip an unbiased coin many, many times, the number of heads and tails are close to equal."
Does your simulation data bear this out? Are you surprised by this result? What is in fact close to equal for large number of flips of a coin?
2. With your group, figure out how to simulate rolling of a single die in Excel. (A die is a cube whose six sides are numbered 1 through 6 and designed so that each side is equally likely to face upwards when the cube is thrown.)
a. After you figure out how to simulate rolling a single die, simulate 300 rolls, and fill in the following table.
| Die Outcome | Frequency | Theoretical Frequency | Deviation from Theoretical | Relative Frequency |
| 1 | 50 | |||
| 2 | 50 | |||
| 3 | 50 | |||
| 4 | 50 | |||
| 5 | 50 | |||
| 6 | 50 |
b. Next simulate 30000 rolls, and fill in the following table.
| Die Outcome | Frequency | Theoretical Frequency | Deviation from Theoretical | Relative Frequency |
| 1 | 5000 | |||
| 2 | 5000 | |||
| 3 | 5000 | |||
| 4 | 5000 | |||
| 5 | 5000 | |||
| 6 | 5000 |
c. In a well-written paragraph, describe the patterns you see in the two data tables. What is similar between these results and the table of coin flips in question 1?
d. Critique the statement "If I roll a die many, many times, the number of 1's, 2's, 3's, 4's, 5's, and 6's that appear are about equal." Is it true? What is true? (Hint. Your table shows what is true.)