ISP 120 Final Review
1. You may bring in one sheet
of notes (8-1/2 by 11, front and back) on savings accounts, loans and credit
cards only.
Your notes will be inspected before the exam. If you include any other
topics, you will not be able to use your one sheet of notes. You will
not have access to any other materials, including materials online.
2. You may bring a small note
card (or piece of paper) that explains how to use goal seek.
2. The exam will have
approximately 10 questions with sub parts.
3. You will have 2 hours and 15
minutes to complete the exam (the exam will start at 5:45 and end at 8:00, be
on time!).
4. You may use a calculator
(online or your own).
5. The final exam is
cumulative!
Percentages and Rates
1. The following table list the 1998 average daily circulation of ten
newspapers with the largest daily circulation in the US.
| Newspaper |
1998 Circulation |
| Wall Street Journal |
1,740,450 |
| USA Today |
1,653,428 |
| Los Angeles Times |
1,067,540 |
| New York Times |
1,066,658 |
| Washington Post |
759, 122 |
| New York Daily News |
723, 143 |
| Chicago Tribune |
673,508 |
| Newsday (Long Island, NY) |
572,444 |
| Houston Chronicle |
550,763 |
| Chicago Sun-Times |
485,666 |
a. How many times larger is the circulation of the Wall Street Journal
greater than
the circulation of the Chicago Tribune?
Answer. The circulation of the
Wall Street Journal is
2.58 times larger than the circulation of the Chicago Tribune. The calculation is
1,740,450/673,508 » 2.58.
b. By how many percent is the circulation of the Chicago Tribune larger than
the circulation of the Chicago Sun-Times?
Answer. The circulation of the Chicago Tribune is 38%
larger than the circulation of the Chicago Sun-Times. The calculation is
(673,508 - 485,666)/485,666 »
0.38 = 38%.
c. The newspaper that had the larger circulation in the world was Yomiuri Shimbun in
Japan. Its 1998 circulation was 14,532,694. By how many percent is its
circulation larger than the circulation of the Wall Street Journal?
Answer. Yomiuri Shimbun has a circulation 735% larger
than the Wall Street Journal. The calculation is (14,532,694 -
1,740,450)/1,740,450 » 7.35 = 735%.
d. The circulation of the Chicago Tribune in 1988 was 774,045. By how many
percent did the circulation drop from 1988 to 1998?
Answer. The circulation of the
Chicago Tribune dropped 13 %. The calculation is (774045 -673508)/774045
»
0.13 = 13%.
2. In the period January 2000 to March 2000, stock for Sapient Corporation, a
consulting company that helps businesses put their operations on the internet, dropped 51%
and then rose by 49%. By how many percent did price change over the whole period?
Answer. Starting at 100%, the stock dropped to 49% of its
original value. It then increase by 49% of the 49%, i.e., 0.49*0.49 = 0.2401 or 24.01% of
the original price. Thus in the end it was 49% + 24.01% or 73.01% of its original value.
It was down 26.99%.
3. Cigarette in the US has decreased over the last 20 years, even though the
rate is still relatively high. In 1998, 277 of every 1000 individuals in the US
over the age of 12 reported that they were smoking, a 28% decrease since 1985.
What was the rate in 1985?
Answer.
x - (0.28*x) = 277
x*(1 - 0.28) = 277
x(0.72) = 277
x = 277/0.72
»
385
The answer is approximately 385 of every
1000 individuals over the age of 12.
4.
a. At DePaul University, minority
students represented 31% of the enrollment in 2001. If there were 21,363
students enrolled in 2001, about how many of these students are minority
students?
6622.53 or about 6622 students
b. Chicago’s population grew from 2.78 million
in 1990 to 2.90 million in 2000. By how many percent did it grow?
4.3% increase
c. The January 14, 2002
issue of TIME magazine reported that Wal-Mart’s 3rd quarter revenues
for 2001 were 600% more than its No. 2 competitor, K-Mart. What were K-Mart’s
revenues during this period if Wal-Mart’s revenues were $48 billion?
$6.86
billion
d. In 1993, 248.7 million people in the United
States were born in the United States, and the rest, 19.8 million were foreign
born. What percentage of the population of the US was foreign born?
7.4%
foreign born
e. Over the last four
years, DePaul’s freshman class has grown by 66%. What is the Fall 2001 freshman
enrollment if the 1997 enrollment was 1234 students?
2048
students
5.
In 2001, 6,113 applicants were accepted to DePaul. This represents about a 72%
acceptance rate. Of the students who were accept, 2,050 students enrolled at the
university.
-
How many students in 2001 applied for admission
at DePaul?
-
What percent of the students who were accepted
to DePaul actually enrolled at the University?
a. 8490
students applied
b. 33.54% of students who were accepted enrolled
6.
The January 13, 2002 issue of the New York Times reported that
there were 547,867 foreign students enrolled at US colleges and universities in
2000-01 — representing a 6.4% increase from the previous year.
a.
How
many foreign students were studying in US colleges and universities during
1999-2000?
b.
The greatest number (59,939) of
foreign students came from China. What percent of the foreign students studying
in the US were from China?
a. 514,91 foreign students
b. 10.94% from China
7. The December 11, 2002 issue of Sports
Illustrated reported that the federal spending for Olympic Games held in the
United States was $610 million for the 1996 Atlanta Games and $1.5 billion for
the 2002 Salt Lake City Games. (The figures have been adjusted for inflation.)
a.
How many times
more federal money was spent on the Salt Lake City Games than the Atlanta Games?
b.
By
what percent is the federal spending for the Salt Lake City Games more than the
Atlanta Games?
c. By what
percent is the federal spending for the Atlanta Games less than the Salt Lake
City Games?
a.
2.46 times more
b.
146%
c.
-59.33%
Consumer Price Index
8. Carefully describe a) what the CPI is, b) how it is constructed, and c) what the meaning of
actual index numbers is (e.g., the CPI in 1999 was 166.6; what does 166.6 mean?)
The CPI is number used to measure the changing value of money
over time. It is published by the US Bureau of Labor Statistics.
Economists select an imaginary "market basket" of goods and services that
represents the buying patterns of most people. Every month they collect price data
on the items in the basket and essentially compute the value of the entire basket. The CPI
is literally the ratio of the price of the basket in a given year to the price of the
basket in a chosen base period multiplied by 100. For example, the 166.6 CPI in 1999
means that the price of the standard market basket is 1.666 times as much as it was in the
base period (1982-84). It means that in 1999 the same goods and services cost about
66.6% more than they did in 1982-84. Another interpretation of the
index number 166.6 is the following: a person would have to pay $166.60 to buy
the same goods and services that a person could buy for $100.00 in the base
period on average. For more information, read the
CPI Tutorial.
9. Open the Defense.xls
file. this file contains the data on U.S. spending for national defense for fiscal years
between 1960 and 2002.
- Using the CPI,
add a column to the table in which you calculate defense spending for these years in
constant 2002 dollars, and cut and paste the table into your word document.
You need to paste in the CPI values in column C. The needed Excel formula
in column D is =B5*179.9/C5 or =B5*$C$47/C5. The top of the table is:
|
Year |
Spending |
CPI |
Spending in 2002$ |
|
1960 |
53.5 |
29.6 |
325.2 |
|
1961 |
55.3 |
29.9 |
332.7 |
|
1962 |
57.9 |
30.2 |
344.9 |
|
1963 |
58.9 |
30.6 |
346.3 |
|
1964 |
60.5 |
31.0 |
351.1 |
|
1965 |
56.3 |
31.5 |
321.5 |
|
1966 |
64.1 |
32.4 |
355.9 |
|
1967 |
78.1 |
33.4 |
420.7 |
|
1968 |
88.9 |
34.8 |
459.6 |
|
1969 |
90.2 |
36.7 |
442.2 |
|
1970 |
90.4 |
38.8 |
419.1 |
- Create an XY graph showing spending in constant 1999 dollars for the period 1960-2002.
- In a well written paragraph describe the graph you made in c.
Defense spending was about 300 million dollars in 1960.
It rose slightly in the early Sixties before dropping to it absolute minimum during the
period 297 million in 1965. It then rose dramatically, achieving a local maximum of
426 million in 1968, the height of the Vietnam War. Defense dropped fairly rapidly
from 1968 until 1974. It then remained fairly constant (at about the 320 million
level) until 1981. During the Reagan administration in the early Eighties, defense
spending shot up, and defense spending was at it highest point in the entire period in
1986 (456 million). Spending leveled off a bit in the late Eighties but then plunged in
the Nineties. In the late 1990s, it remained relatively constant. After
9/11/2001, defense spending increased dramatically. The overall picture shows two massive arms buildups, one
corresponding to the Vietnam War and the other to the Reagan Administration's Strategic
Defense Initiative and other Cold War efforts. We are perhaps at the start
of another arms buildup.
10. According to the Defense.xls
file, spending for national defense in 1985 was $279 billion and in 2002 it was
$399.5 billion.
a) Discuss why you cannot conclude that the spending on defense
increased in value from 1985 to 2002.
Since the value of the dollar decreases over time due
to inflation, it is hard to compare spending from 1985 to 2002. You cannot
conclude that the actual dollars spent increased that the value of the spending
increased. The value of the dollar is not the same in both years.
b) Using the information in
CPI.xls, convert the 1985 actual spending to 2002 constant dollars.
Compare this value to the actual 2002 spending. What does it tell you
about defense spending over these years.
new CPI/old CPI * old actual $ = 179.9/107.6*279 =
466.5. 1985 spending in 2002 constant dollars is $466.5 billion.
This is much higher than the actual spending in 2002. This means defense
spending grew less than inflation over the 17 years. Defense spending was
very high in the mid-1980's.
c) The 2002 constant dollar value of the 1985 spending is what percent
larger than the actual spending in 2002?
(466.5-399.5)/399.5 = 16.7%
Trendlines and Graphs
11. Below is a trendline graph of the number
cellular telecommunications subscribers from 1994 - 2003.
a. Based on what you learned about creating
effective graphs, list two concerns about the above graph.
b. Using your equation, predict when their were
no cell phone subscribers. How much faith do you have in your
prediction?
Based on the data from 1994 through 2003, there were no cell phones in
1993. Using your knowledge about cell phones, the equation is not a good fit for the
data (when predicting backwards) because there were cell phones in 1993.
c. Using your equation, predict the number of
subscribers in 2030. How much faith do you have in your
prediction? Based on
date from 1994 through 2003, there will be approximately 573,933,000 in
2030. Once again, practical knowledge dictates whether or not we
have faith in the prediction. Since technology changes so quickly, 2030 is too far out for a prediction.
Also, 573,933,000 far exceeds the current U.S. population.
Exponential Modeling and Solving Exponential Equations
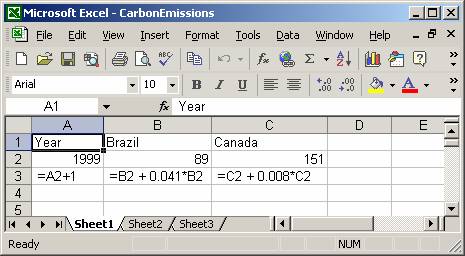
12. Carbon dioxide emissions from the burning of fossil
fuels is almost surely a cause of global warming. One of the difficulties in
negotiating a treaty for the reduction of carbon dioxide emissions is the
discrepancy in emission levels between developing and developed nations. For
example, in 1999, Brazil emitted 89 million metric tons of carbon into the
atmosphere, while Canada, a much less populous country, emitted 151 million
metric tons. Brazil’s emissions, however, are growing at 4.1% per year, while
Canada’s are growing at 0.8%.
- In Excel, make an exponential model for Brazil’s and
Canada’s carbon emissions.
Answer:
- Using your model, predict when Brazil’s emissions will
exceed Canada’s.
Answer.
Extending the model, in a., Brazil’s emissions will exceed Canada’s in 2016.
- How much confidence you have in your prediction in b?
Answer. I
have only moderate confidence. 17 years is quite far from the existing data.
On the other hand, I have complete confidence that Brazil’s emissions will
exceed Canada’s in the not so distant future. I am not sure that Brazil will be
able to keep up a 4.1% annual rate of percentage increase for so long.
-
Find formula for the exponential
function which models Brazil’s emissions (using 1999 as year 0).
Answer.
f(x) = 89 * (1.041) ^ x or written more traditionally f(x)
= 89(1.041)x.
- Using the formula for Brazil’s model, predict Brazil’s
emissions in 2010.
Answer.
2010 is 11 years after 1999. f(11) = 89 * (1.041) ^ 11
»
138.5 metric tons.
13. In 1994, 24 samples from the archeological site at Oslonki, Poland were dated using
carbon 14. The archeological site is significant for the large quantities of copper
implements and jewelry found there. One of the samples had 47.8% of the carbon
14 that would normally be present in a living organism. Approximately, how old is
the sample? (Carbon 14 decays approximately 1.202% every 100 years.) Please include
the Excel table you used to calculate your answer; if you didn't use an Excel table to
calculate your answer, briefly describe your calculation.
The Excel table is long, so I'll only paste in the beginning.
The sample is about 6100 years old.
14. In 1990, the
population of the town Erehwon was 5000 and has been increasing by 2.9% every
year. The population of the town Exalpon, Erehwon’s nearest neighbor, was 4500
and increasing by 3.2% every year. When, will the population of Exalpon exceed
Erehwon?
|
Year |
Erehwon |
Exalpon |
|
0 |
5,000.00
|
4,500.00
|
|
1 |
5,145.00
|
4,644.00
|
|
2 |
5,294.21
|
4,792.61
|
|
3 |
5,447.74
|
4,945.97
|
|
4 |
5,605.72
|
5,104.24
|
|
5 |
5,768.29
|
5,267.58
|
|
6 |
5,935.57
|
5,436.14
|
|
7 |
6,107.70
|
5,610.10
|
|
8 |
6,284.82
|
5,789.62
|
|
9 |
6,467.08
|
5,974.89
|
|
10 |
6,654.63
|
6,166.08
|
|
11 |
6,847.61
|
6,363.40
|
|
12 |
7,046.19
|
6,567.03
|
|
13 |
7,250.53
|
6,777.17
|
|
14 |
7,460.80
|
6,994.04
|
|
15 |
7,677.16
|
7,217.85
|
|
16 |
7,899.80
|
7,448.82
|
|
17 |
8,128.89
|
7,687.19
|
|
18 |
8,364.63
|
7,933.18
|
|
19 |
8,607.20
|
8,187.04
|
|
20 |
8,856.81
|
8,449.02
|
|
21 |
9,113.66
|
8,719.39
|
|
22 |
9,377.96
|
8,998.41
|
|
23 |
9,649.92
|
9,286.36
|
|
24 |
9,929.77
|
9,583.52
|
|
25 |
10,217.73
|
9,890.20
|
|
26 |
10,514.04
|
10,206.68
|
|
27 |
10,818.95
|
10,533.30
|
|
28 |
11,132.70
|
10,870.36
|
|
29 |
11,455.55
|
11,218.21
|
|
30 |
11,787.76
|
11,577.20
|
|
31 |
12,129.60
|
11,947.67
|
|
32 |
12,481.36
|
12,329.99
|
|
33 |
12,843.32
|
12,724.55
|
|
34 |
13,215.78
|
13,131.74
|
|
35 |
13,599.04
|
13,551.95
|
|
36 |
13,993.41
|
13,985.62
|
|
37 |
14,399.22
|
14,433.16
|
In 37 years.
*** Also review the
material on exponential modeling. You will need to be able to solve for time using
logarithms.
Savings Accounts
15. You deposit $2500 in a savings account yielding 4.7%
compounded quarterly.
a. If no money is withdrawn for 8 years, what will be value of
the account.
Answer: 2500*(1 + 0.047/4)^32 »
$3633.15
(You may also use Excel to solve this question.)
b. How long will it take for this account to double in value?
Answer. You could set up the following table in
Excel:
It takes a little
under 60 quarters or 15 years for the account to double.
c. What is annual percentage yield of this account?
Answer. The annual percentage yield for savings
account is percentage change for one year. You can either look at your
table from part b. or you can do the calculation $2500*(1 + 0.047/4)^4 to find
out that the value after one year will be $2619.59. The percentage change
is (2619.59 - 2500)/2500 »
0.0478 or 4.78%.
16. Suppose that you deposit $700
in a bank that offers an APR of 6.25% compounded monthly.
a. What is your account balance after one year?
$745.03
b. What is your
account balance after 8 years?
$1152.61
c. What is the
annual percentage yield for this account?
6.43%
17. Suppose you had $1,500 to deposit in a bank
account. Which of the following rates would you choose? In a
short paragraph, explain your choice.
a. An account with annual compounding and
an APR of 7%.
APY - 7.00%
b. An account with quarterly compounding and an APR of
6.85%.
APY - 7.03%
c. An account with monthly compounding and an APR of 6.7%.
APY - 6.91%
Option b. is better.
Another way to do this problem is to find the account balance
after one year for each option. The largest account
balance wins.
18. Be able to compute compound interest.
a. You put $7,500 in the bank. What is your balance
in 12 years assuming the following situations?
- 8% compounded
annually
$18,886.28
APY - 8.00%
- 8% compounded quarterly
$19,403.03
APY - 8.24%
- 8% compounded
monthly
$19,525.42
APY - 8.30%
b. Determine the APY for each of the
above (shown as a percentage). How many decimal places
must you show at a minimum to distinguish the difference
between APYs. Two
decimal places.
Loans
19. You have decided to
buy a 2003 Chevy Cavalier. The total cost with tax,
title, license and optional equipment is $20,500. You
will make a down payment equal to 10% of the total cost
of the car. The remaining amount will be financed.
You have two financing options.
Option 1 - Get $2,500 cash back. This amount will
reduce the amount you need to finance. You will be
able to get a 5 year car loan on the remaining amount
with a 6.0% interest rate from your bank.
Option 2 - Get no cash back and finance the entire
amount. The loan will be for 3 years with a 0.0%
interest rate from GMAC financing.
a. What is the amount of money that you will need to
borrow under Option 1? ($15,950)
b. Make an amortization table for Option 1 and verify
that your ending balance after 60 months is zero. Paste
the first five lines (months 0 - 4) in your Word
document. What is your monthly payment? What is the total
amount paid over the term on the loan?
|
Month |
Beg Balance |
Payment |
Interest |
Principal |
End Balance |
|
0 |
|
|
|
|
15950 |
|
1 |
15950 |
$308.36 |
79.75 |
$228.61 |
$15,721.39 |
|
2 |
15721.39182 |
$308.36 |
78.607 |
$229.75 |
$15,491.64 |
|
3 |
15491.64059 |
$308.36 |
77.458 |
$230.90 |
$15,260.74 |
|
4 |
15260.74061 |
$308.36 |
76.304 |
$232.05 |
$15,028.69 |
($308.76, $18,501.49)
c. How much will you need to borrow if you choose option
2? What is your monthly payment?($18,450, $512.50)
d. Which financing option should you choose? Explain.
You
can decide which is more important, the payment amount or the total
amount you pay over the duration of the loan.
Credit Cards
20. You only use your credit card in the case of an
emergency. You charge $4,000 in auto repairs to credit card which has an annual
interest rate of 11.99%. What should your monthly payment be if you would like
to pay off your balance in full after two years?
$188.28
21.
You make a purchase for $3,501 on your credit card which
has an annual interest rate of 17.99%. If you pay the minimum payment of 2% per
month (not less than $25), what is your balance after 4.5 years, assuming you
make no other purchases with your credit card?
$2,669.57
22. You make a purchase for $2,723 on
your credit card which has an annual interest rate of 15.99%. The
credit card company offers a minimum payment of 3% per month (not
less than $25). How many years will it take your balance to equal
$10.00 assuming your make no other purchases with your credit
card?
between and 114 and 115 months