The Consumer Price Index
A Way to Compare Prices in Different Years
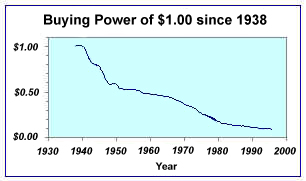
Inflation is a decline in the value of money in relation to the goods that it can buy and is a pervasive economic phenomenon. It is so pervasive that it is very difficult to compare this year’s prices to last year’s, much less compare prices over decades. Here is a graph of the buying power of $1.00 since 1938:
How is the "buying power" of $1.00 measured? How can we compare prices of item in different years? The answer is the use of price indices such as the consumer price index or CPI. Below is a simplified explanation of how the indices are created and how we can use them. Economists choose a base year and determine the price of a "bundle" of goods: food, clothing, housing costs, transportation costs, services, entertainment in varying proportions. The proportions for the index we are using (CPI(U)) are
|
Components of the CPI(U) |
|
| Housing |
41.4% |
| Transportation | 17.8% |
| Food | 16.2% |
| Energy | 8.2% |
| Medical Care | 6.4% |
| Apparel and Upkeep | 6.1% |
| Other | 3.9% |
The cost of this bundle in one year is assigned an index number. The next year, the cost of the same bundle is determined. The CPI for that year represents the new cost of the bundle.
Using the Consumer Price Index
The table below shows the official CPI since 1990. We will explore how it is used.
| Year |
CPI 1982-84=100 |
| 1990 | 130.7 |
| 1991 | 136.2 |
| 1992 | 140.3 |
| 1993 | 144.5 |
| 1994 | 148.2 |
| 1995 | 152.4 |
| 1996 | 156.9 |
| 1997 | 160.5 |
| 1998 | 163.0 |
| 1999 | 166.6 |
| 2000 | 172.2 |
| 2001 | 177.1 |
| 2002 | 179.9 |
| 2003 | 184.0 |
| 2004 | 188.9 |
| 2005 | 195.3 |
| 2006 | 201.6 |
How can you interpret the table?
The beauty of this table is that we can easily compare any two years prices. For example, from the table we can see that
in 1990, it would cost $130.70 for goods and services costing $201.60 in 2006.
But also from the table we can see that
in 1995, it would cost $152.40 for goods and services costing $201.60 in 2006.
We can therefore say that $130.70 in 1990 is equivalent to $152.40 in 1995 which is equivalent to $201.60 in 2006.
A relationship between the factors...
This information will allow us to calculate how many times more the prices of goods were in one year than in another. Using 1995 and 2006 as an example, we can calculate the ratio of the CPI values for those two years:
Comparing amounts from two different years (converting to Constant Dollars "by hand")
Example One: The CPI allows you to convert anything money related (prices, wages, salaries) from one year to another. For example, let's say your instructor said she made $18,000 a year at her first job out of college in 1988. That doesn't sound like a lot of money to us today, but we must consider that everything was less expensive in 1988. What is that salary worth in today's money (in 2006)? To answer that, we can convert the $18,000 to 2006 constant dollars using the CPI values for those years.
The CPI table tells us that
118.3 in 1988 dollars is equivalent to 201.6 in 2006 dollars.
We wish to know
$18,000 in 1988 dollars is equivalent to ? in 2006 dollars.
One way to conceptualize the conversion to constant dollars is to focus on the meaning of the ratio of the CPI's (found in CPI.xls):
This ratio tells us that one dollar in 1988 is equivalent to $1.70 in 2006. Another way to think about it is that prices were, on average, 1.7 times more in 2006 than in 1988. Multiplying the wage of $18,000 by this ratio completes the conversion
18,000 * 1.7 = $30,600
This means that your instructor's $18,000 salary in 1988 is equivalent to making $30,600 a year today (in 2006).
Example Two: This interpretation of the CPI also allows us to compare prices in two different years and determine when an item was more expensive. We can calculate whether an item increased in price at the same rate as the "bundle of goods" or at a faster or slower rate.
For example, the price of gasoline in 1981 was $1.38 per gallon on average. In 2005, it averaged $2.30. Was gasoline more expensive or less expensive in 2005?
On the face of it, it seems that gas is more expensive in 2005. The actual price is definitely higher in 2005, but that is to be expected. The prices of (almost) everything are higher in 2005 than in 1981. But just comparing the actual prices does not take the changing value of money into consideration. To compare the prices taking inflation into account, we convert one of the prices to the the other year's constant dollars. Usually, we convert forward to the more recent year. In our example, we want to convert the 1981 price of $1.38 to its equivalent in 2005 constant dollars. Using the CPI values (found in CPI.xls):
What this tells us is that $1.38 in 1981 was equivalent to $2.96 in 2005. $2.96 is the 1981 price in constant 2005 dollars. In other words, when Americans paid $1.38 per gallon for gasoline in 1981, it was equivalent to paying $2.86 in 2005. We can now compare the actual price in 2005 to the 1981 price in constant 2005 dollars. Since $2.96 is more than the $2.30 that people were actually paying in 2005, gasoline was more expensive in 1981 than it was in 2005.
Example Three: Try a similar calculation comparing the price of gas in 1990 which was $1.16 to the price of gas in 2000 which was $1.51. Again, nominally, the price in 2000 is larger than the price in 1990, but that is to be expected. When did it "feel" more expensive to buy gas? Convert the 1990 price to its 2000 constant dollar equivalent by multiplying the 1990 price by the ratio of the CPI values in 2000 and 1990:
The general formula for converting to constant dollars :
(New CPI) / (Old CPI) * (Old Price) = Price in constant dollars
Comparing amounts from many consecutive years (converting to Constant Dollars "using Excel")
Example Four: Another use of the CPI is to convert an entire series of prices to constant dollars. For example, consider the price of electricity from 1986 to 2006 (found in Electricity.xls, you will also need CPI.xls ):
Electricity Prices (US city average, per KWH) 1986 $0.077 1987 $0.079 1988 $0.080 1989 $0.082 1990 $0.084 1991 $0.087 1992 $0.088 1993 $0.092 1994 $0.092 1995 $0.094 1996 $0.094 1997 $0.094 1998 $0.087 1999 $0.086 2000 $0.087 2001 $0.092 2002 $0.091 2003 $0.093 2004 $0.094 2005 $0.100 2006 $0.112 In graphical form, the data looks like:
The graphs shows the price of electricity rising from a minimum of 7.7¢ per kilowatt-hour in 1986 to its maximum in 2006 of 11.2¢. Since the value of the dollar decreased each year, this graph is not a realistic depiction of electricity costs over this period. While this graph does show that the nominal cost of electricity rose each year, it is incorrect to assume that electricity became more expensive over the years. To get a more accurate understanding, we should convert the entire data series to constant 2006 dollars. The spreadsheet below depicts the calculation. First one would copy and paste the CPI values from CPI.xls. Next one would fill a column with the "old" actual price multiplied by the ratio of the CPI's involved.
A B C D 1 Electricity Prices (US city average, per KWH) 2 1986 $0.077 109.6 =$C$22/C2*B2 3 1987 $0.079 113.6 $0.140 4 1988 $0.080 118.3 $0.136 5 1989 $0.082 124.0 $0.133 6 1990 $0.084 130.7 $0.129 7 1991 $0.087 136.2 $0.128 8 1992 $0.088 140.3 $0.127 9 1993 $0.092 144.5 $0.128 10 1994 $0.092 148.2 $0.125 11 1995 $0.094 152.4 $0.124 12 1996 $0.094 156.9 $0.121 13 1997 $0.094 160.5 $0.118 14 1998 $0.087 163.0 $0.107 15 1999 $0.086 166.6 $0.104 16 2000 $0.087 172.2 $0.102 17 2001 $0.092 177.1 $0.105 18 2002 $0.091 179.9 $0.102 19 2003 $0.093 184.0 $0.102 20 2004 $0.094 188.9 $0.101 21 2005 $0.100 195.3 $0.103 22 2006 $0.112 201.6 $0.112
You might wonder why you don't use the formula =C22/C2*B2. This formula will not fill correctly, since C22 needs to be used again in each cell (not C23, C24, ...). You need to either enter the "new" CPI as the actual number (=201.6/C2*B2) or =$C$22/C2*B2 which uses an absolute cell reference for C22. To get an absolute cell reference, enter the cell reference then hit the F4 button on the top of the keypad. (You could also manually enter the dollar signs before and after the letter OR you can just enter the number in that cell instead of a cell reference). An absolute cell reference tells Excel to keep that cell the same in the subsequent calculations.
Here is the graph of electricity costs in 2006 constant dollars:
In fact, electricity costs (in constant dollars) went down from 1986 to 1998. Actual electricity prices increased at a rate less than inflation. From 1998 to 2005 electricity prices stayed about the same. Actual electricity prices increased at a rate equal to inflation. Prices were just starting to increase again from 2005 to 2006 or increase at a rate greater than inflation. In 2006 constant dollars, electricity costs were at their highest in 1986, when they were nearly 14.1¢ per kilowatt-hour. The minimum was in 2004, at 10.1¢ per kilowatt-hour. The graph in constant dollars tells a very different (and more realistic) story of electricity costs.
Graphs of prices in constant dollars tell you whether the actual price of an item has grown faster, slower, or at the same rate as inflation. If the graph increases, prices have grown faster than inflation and have become more expensive; if it decreases, prices have grown slower than inflation and have become less expensive; and if it is a flat horizontal line, prices have grown at the same rate as inflation.
Using the Consumer Price Index to Calculate Inflation
Example Five: Finally, the inflation rate is defined as the percentage change in the CPI from the previous year to the next. For example, the inflation rate in 1996 was
Updated Fall 2007 by Tracey Connor using materials developed by David Jabon and Cathy Evins.